
Workspace
Plan : FreeA 3D scene at the heart of the application, where an 8-dimensional polytope and a customer file are viewed the same way.

Business problems
- A fifteen-column table cannot be read in a two-axis scatter plot.
- An analysis has to be shown and discussed in a meeting, not just exported as a table.
- Too many options kill a tool: each user only wants what serves their own job.
Academic problems
- Show a fourth dimension, or a twelfth, instead of describing it.
- Move from a geometric figure to a data cloud in the same scene, with the same projection tools.
Methods & guarantees
- The user mode hides tabs and shapes; it changes no computation.
- Settings export to JSON and re-import identically.
- Voice recognition runs on the machine: neither the audio nor the transcript leaves the browser.
A 3D scene at the centre, everything else within reach
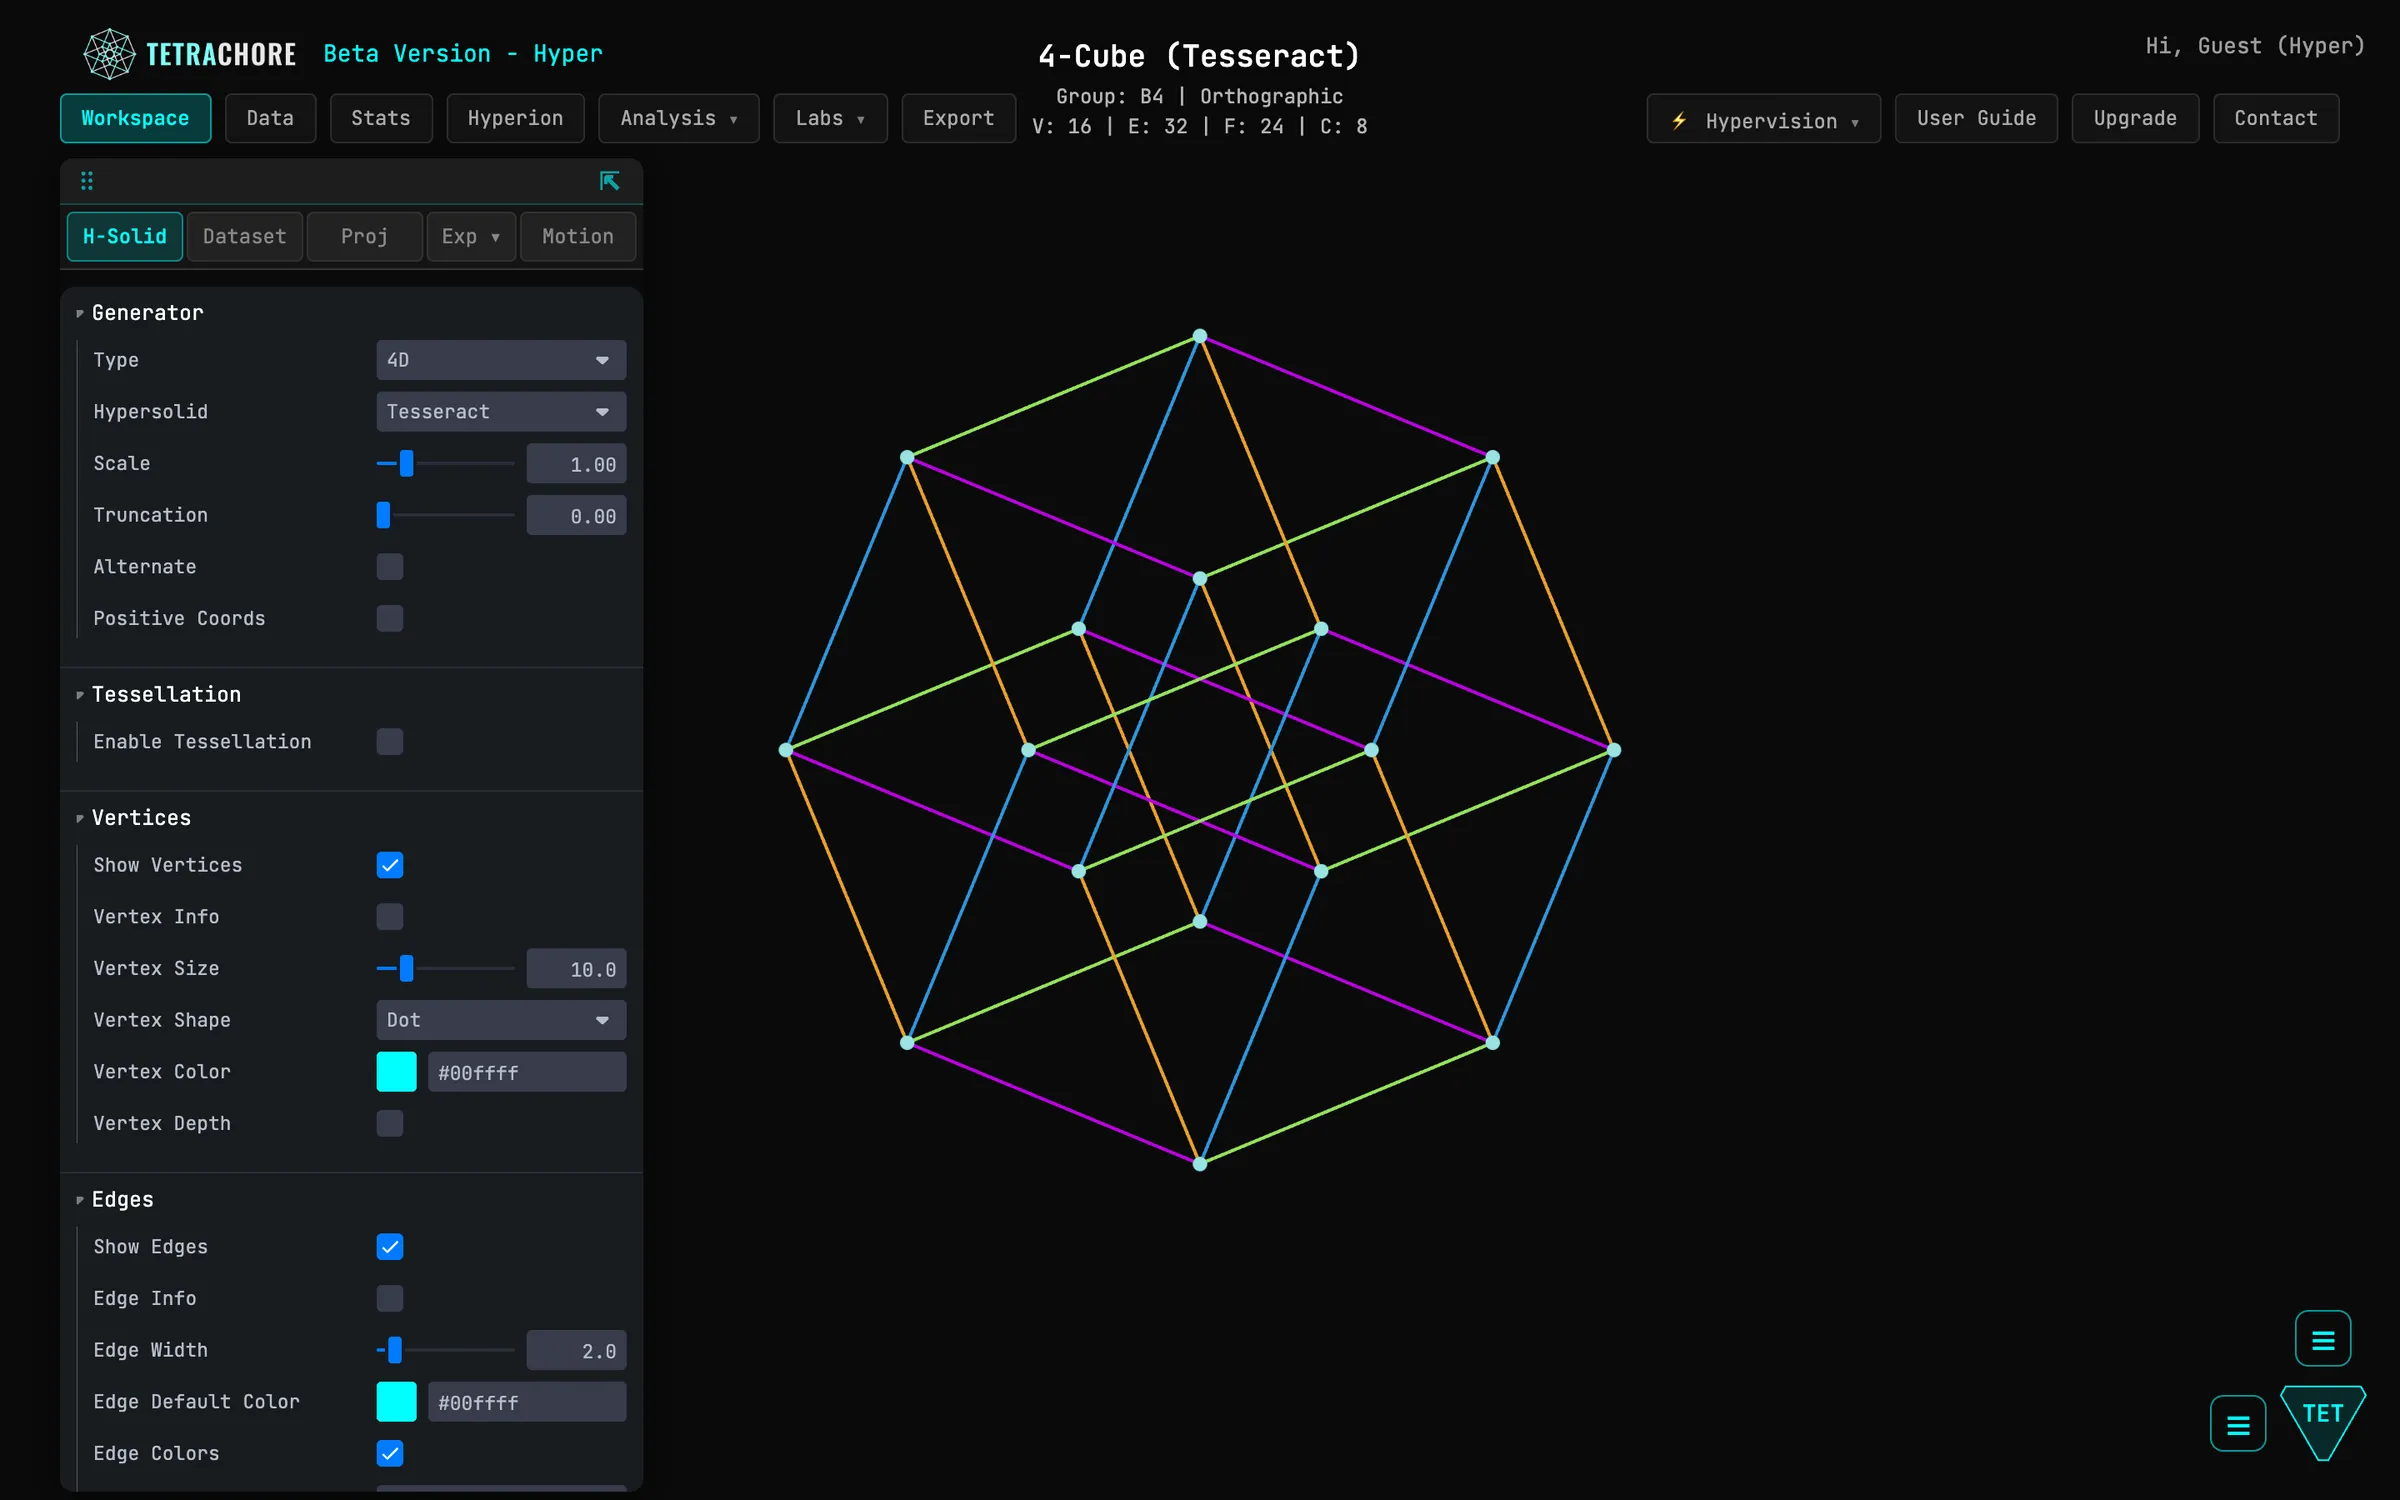
The Workspace tab is the heart of the application. The scene fills the screen; its settings sit in a floating panel you can move and collapse. Five buttons open its sections: H-Solid (= Hypersolid) to generate and style a figure, Dataset for datasets and point style, Proj (Projection) for scaling and projections, Exp (Exploration) to handle the projected cloud, Motion for animation and dynamic effects.
The other tabs sit around it: Data for import and preprocessing, Stats, Hyperion for one-click analysis scenarios, the Analysis menu that gathers the analysis modules, the Labs menu for the showcases (Hy-Personality, quantum gates), and Export.
Three pages detail what the scene does: hypersolids, data exploration, and an application of 4-dimensional hyperspheres, quantum gates.
Show only what serves your job
A selector at the top right picks the user mode. Explorer opens the whole shape catalogue and the geometry and personality tabs. Data Scientist puts factor analysis, clustering, supervised learning and forecasting forward. Business Analyst gathers performance management: uplift, Marketing Mix Modeling, survival, optimization. Hypervision opens everything.
The mode lightens the interface, nothing more: computations are the same in every mode.
Drive the scene from the keyboard, or by voice
Common gestures have a shortcut: switch tab or section, rotate the scene, change view, show or hide an element, run the current tab's computation. The ? key shows the full list, generated from the application itself.
Some of these commands can be spoken, in English or French, in Chrome and Edge, in Push-to-talk or continuous listening. Recognition happens on the machine: you can talk to the application during a meeting without sending anything to a third-party service.
Keep and share what you have built
The Export tab gathers the outputs. View (PNG) saves the scene as displayed, transparent background included. Export All Config saves every setting to JSON, Import Config restores them. Projected Data (CSV) exports the projected coordinates, and each analysis module has its own extractions.
Charts Recap (PDF) assembles the charts produced during the session into a single document: a report ready to send, without exporting each chart one by one.
In this section
Try it on your own data
Everything runs in your browser: your data never leaves it.
Open TetrachoreUpdated 7 November 2026