
Hy-Performance
Plan : HyperKnow which marketing actions really pay, which lose money, and which cannot be measured yet.

Business problems
- Your campaigns have a control group, yet nobody can say which ones paid back their budget.
- An aggregate table shows a flattering uplift that the actions, one by one, do not confirm.
- You must choose between the current action and a new one, and no customer can be left uncontacted.
Academic problems
- Teach A/B testing with its real pitfalls, multiplicity, winner's curse, Simpson's paradox.
- Evaluate a treatment in a clinical trial, in its own terms, ICER and NNT included.
Methods & guarantees
- Every action must pass estimability and precision thresholds before an uplift or ROI is kept.
- Optional Benjamini-Hochberg correction over the whole family of tests.
- Per-action chi-square test against a declared target/control ratio, to catch a contaminated control group.
- Aggregate uplifts standardized on a single population, never recomputed from totals.
See at a glance where the money goes and what it returns
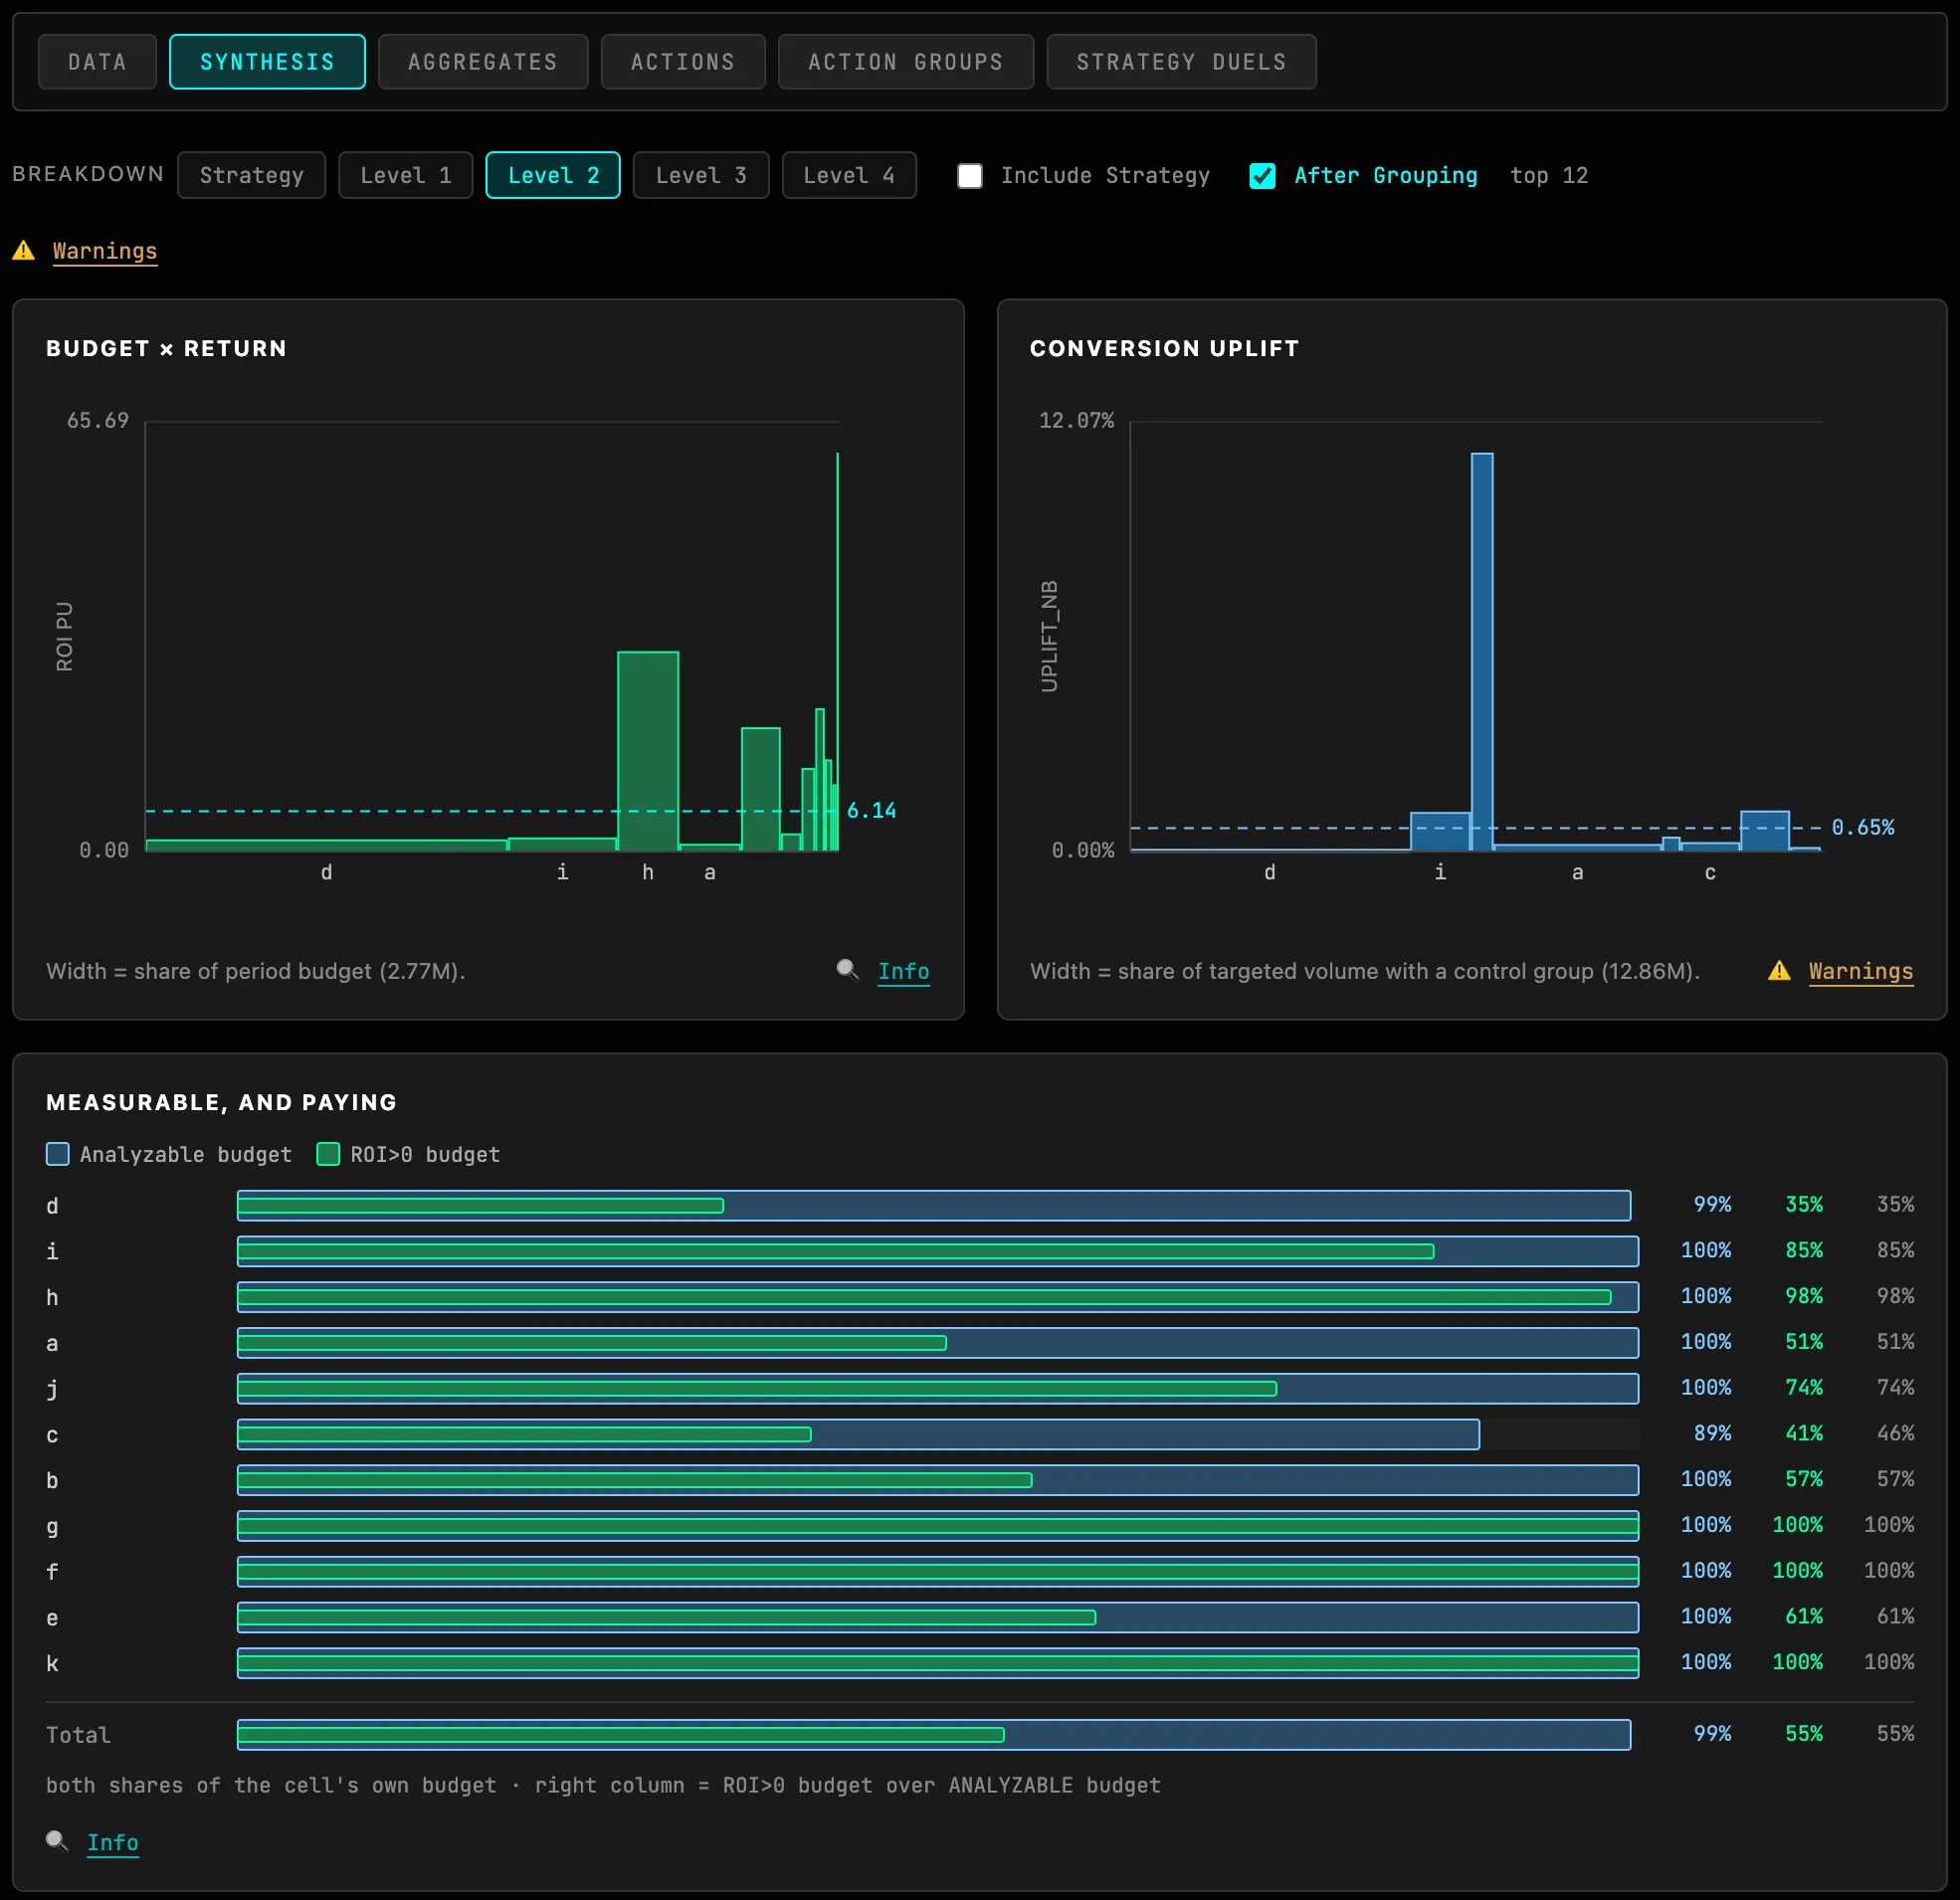
Run Performance opens straight onto the Synthesis view, which sums up a period in seven charts. In Budget × Return, a bar's width is its share of the budget and its height the return per unit spent. The bar's area is therefore what that segment earned: size and return are read together, and never contradict each other.
The breakdown is one click away, from strategy down to the finest level. Nothing is computed just for the charts: every figure in Synthesis is also in the Aggregates table.
Separate the profitable actions from the noise
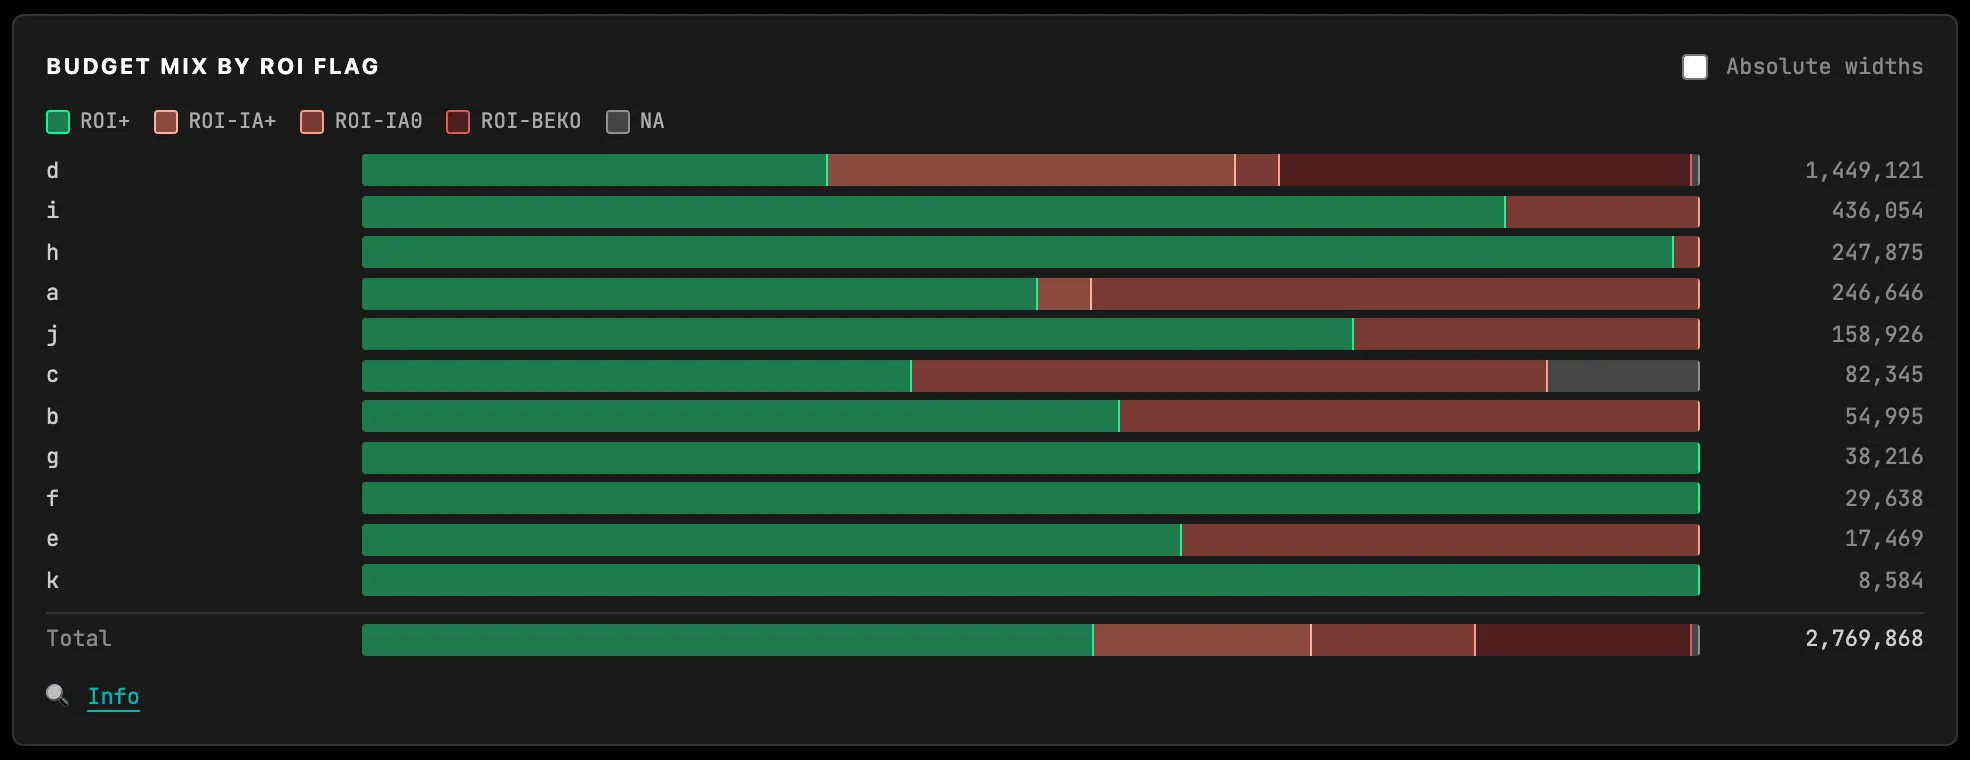
An action only gets an uplift or ROI after passing separate checks: enough conversions to estimate a rate (Analyz Min Conv), and a relative standard error under a ceiling (Max Relative Prec (%)). Otherwise it is flagged NA, and its budget leaves the analyzable indicators instead of being counted silently.
An NA is not a dead end. It is re-tested under a simulated increase in volume (Vol Increase Factor): some actions simply need to be run again with more customers.
Spot the real winners in the 3D scene
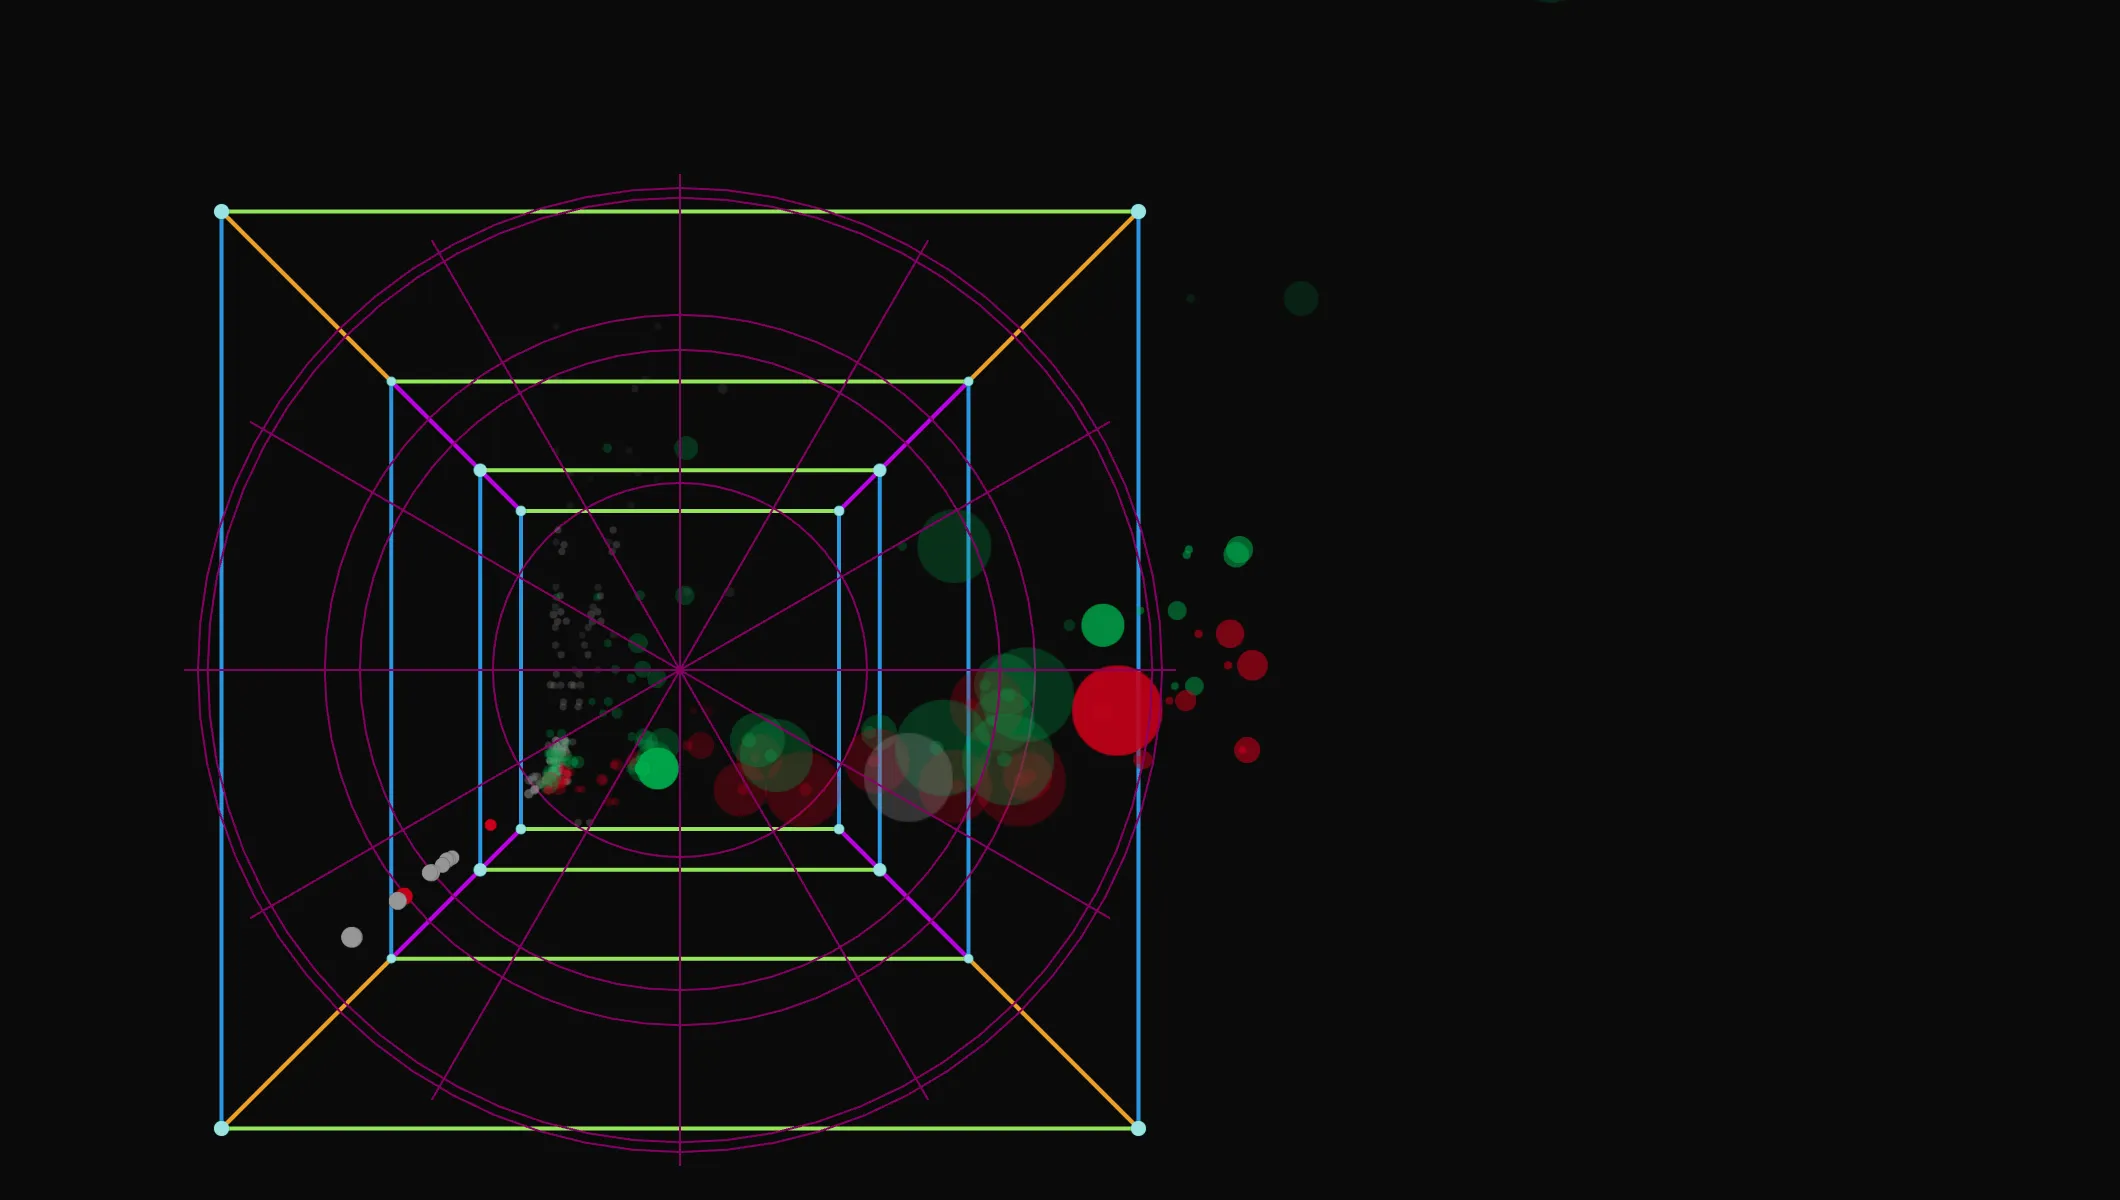
The Hy-Perf — winners vs noise scenario carries the same reading into the 3D scene. Each point is an action: its colour says whether it makes money net of its budget, its size counts its conversions, and imprecise actions fade out. The ellipsoid wraps the typical mass; the real winners are the solid green points outside it.
Aggregate figures that do not lie
Recomputing an uplift from a portfolio's totals gives a wrong figure as soon as control group sizes vary from one cell to the next. The error can even flip the sign: this is Simpson's paradox. Hy-Performance therefore standardizes every aggregate uplift on a single population, chosen with Weight Base (targets, controls, or both).
The other safeguards are close at hand:
Multi-Test Correctionset toBH-FDRcontrols the share of false discoveries when screening a large catalogue of actions;Expected Ratio (T/C)warns when the observed target/control split drifts from the design;- the
Warningslink of theAggregatestable sets the significance-filtered ROI against the unfiltered one, the truth usually lying in between.
Settle champion against challenger
A new action can be compared with the current one in two ways. Either both are the two arms of a single test, when every customer must receive something. Or each has its own no-contact control group, and the Strategy Duels view publishes the gap between the two strategies in volume, amount and ROI per customer, with its test. A non-inferiority margin lets you conclude that a cheaper option does no worse.
The same computation, in clinical vocabulary
The Vocabulary setting switches display and export from Marketing to Clinical: uplift becomes ATT, ROI becomes NMB. The figures do not change, only the names do. The Aggregates table also gives the ICER, the cost per unit of incremental outcome, and the NNT, the number of people to treat for one more outcome.
Try it on your own data
Everything runs in your browser: your data never leaves it.
Open TetrachoreUpdated 1 November 2026