
Statistics
Plan : FreeSee what a file really holds, test a difference, and describe what sets a group apart from the others.

Business problems
- Before modelling, know which columns have gaps, are constant or are mere identifiers.
- Settle an A/B test from the figures in the campaign report alone, without the row-level file.
- Describe in a few traits what sets apart the customers of a segment, a cluster or a high score.
Academic problems
- Teach the difference between significance and effect size, with gauges to show it.
- Show where an association between two qualitative variables lies, not only that it exists.
Methods & guarantees
- Welch's t-test, without assuming equal variances; paired and non-parametric versions.
- When comparing two proportions, switch to Fisher's exact test as soon as a cell count falls below 5.
- Cross-tabulations read through standardized residuals and cumulative curves, independent of any binning.
Know what needs fixing before you analyse
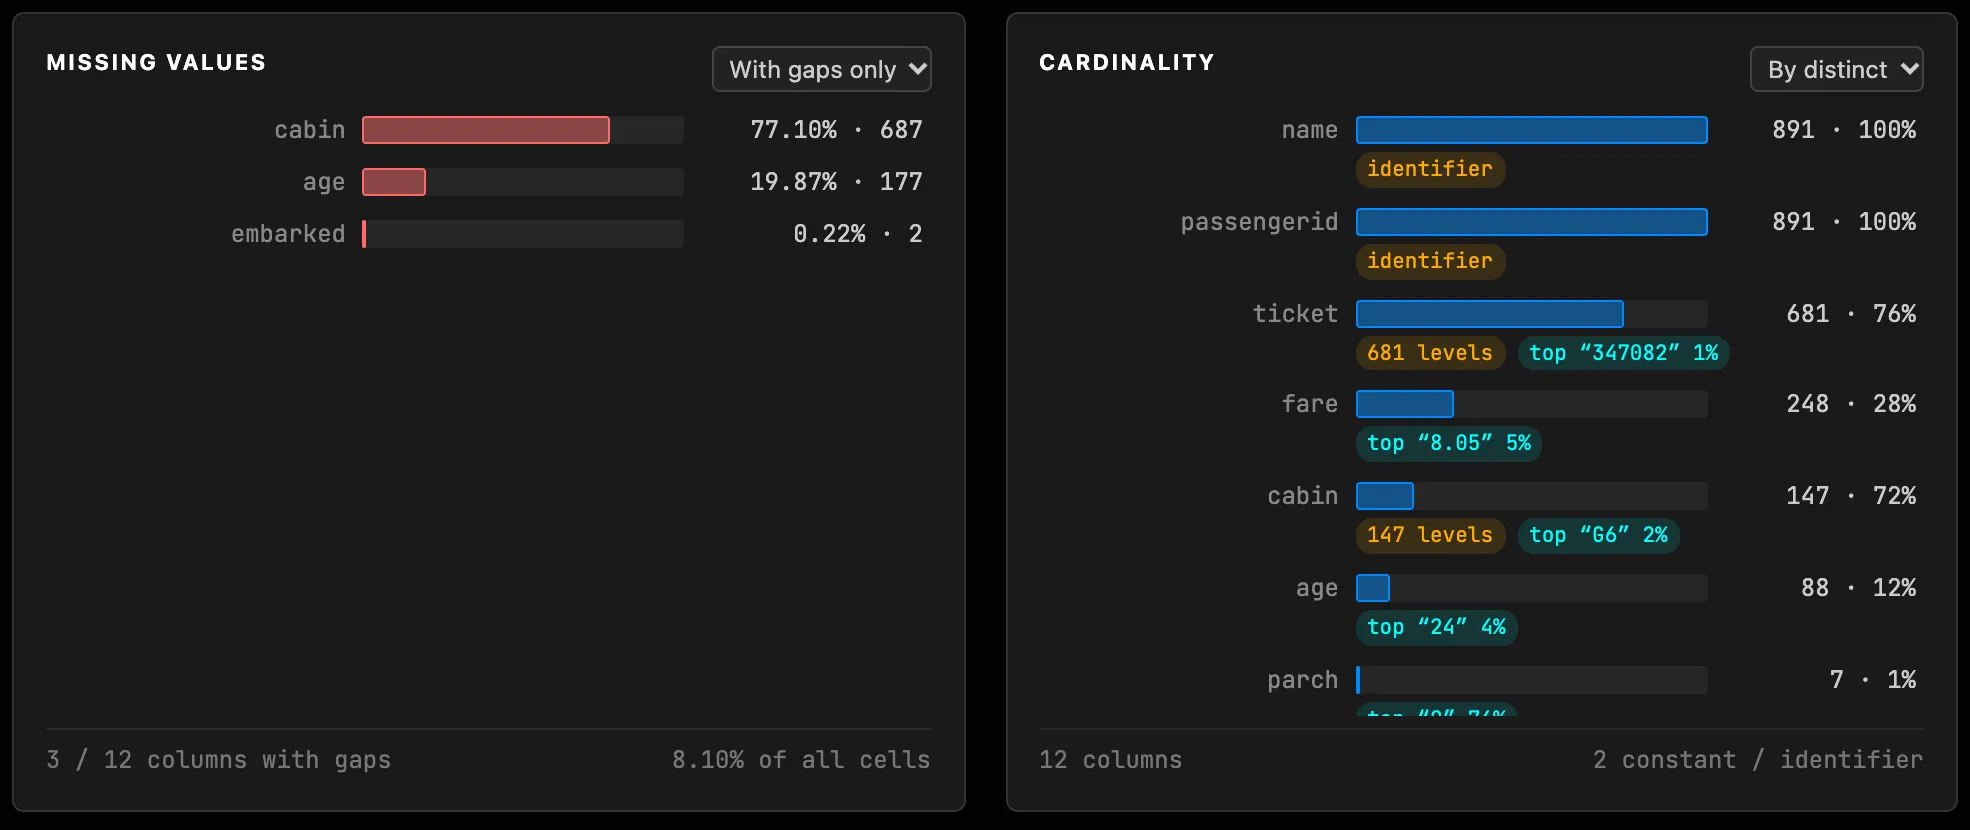
The Stats tab reads from top to bottom, in the order you discover a file. The first row says what is wrong. Missing Values ranks the columns by share of empty cells and flags with an unreadable → 0 badge a numeric column that holds text: those values are not empty, no imputation will handle them, and they shift the mean silently. Cardinality counts distinct values and gives a verdict: constant, identifier, binary, or a number of levels to group before encoding.
Read the shape of each variable
For numeric variables: a dispersion table (quartiles, coefficient of variation, trimean…), box plots, and Normality (QQ), which compares the variable with a normal or log-normal law and tells whether taking the logarithm would really improve the fit. The transformation itself stays an explicit choice, in data preparation.
For categorical variables: the distribution of levels and Pareto, which answers the question that decides an encoding: how many levels cover 80, 90 or 95% of the rows.
See where two variables respond to each other
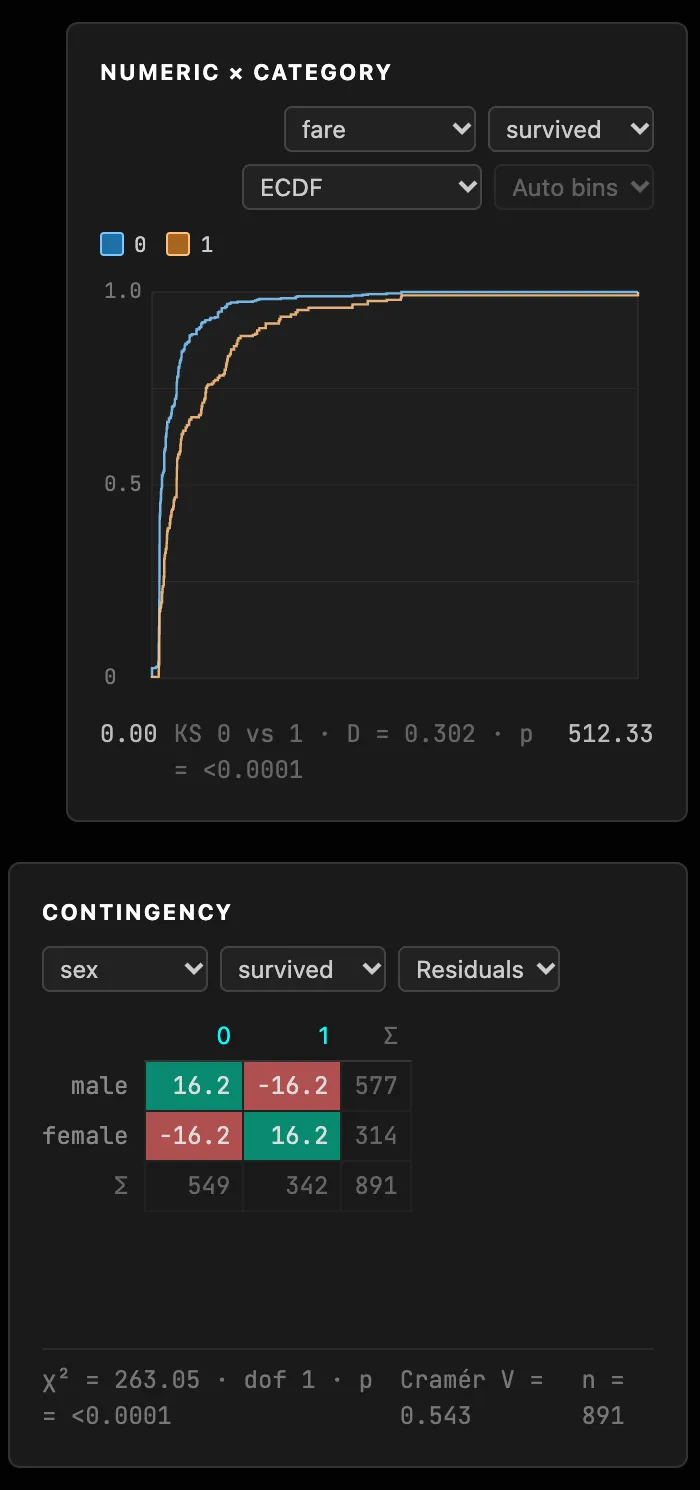
Numeric × Category overlays the distribution of a numeric variable for each class of a categorical one. In ECDF mode, the cumulative curves depend on no binning, and the Kolmogorov-Smirnov distance measures their largest gap.
Contingency crosses two categorical variables in standardized residuals: beyond 2 in absolute value, a cell is clearly over- or under-represented. Cramér's V sums up the association in one number; the residuals say where it lies.
Test a difference, or size a test
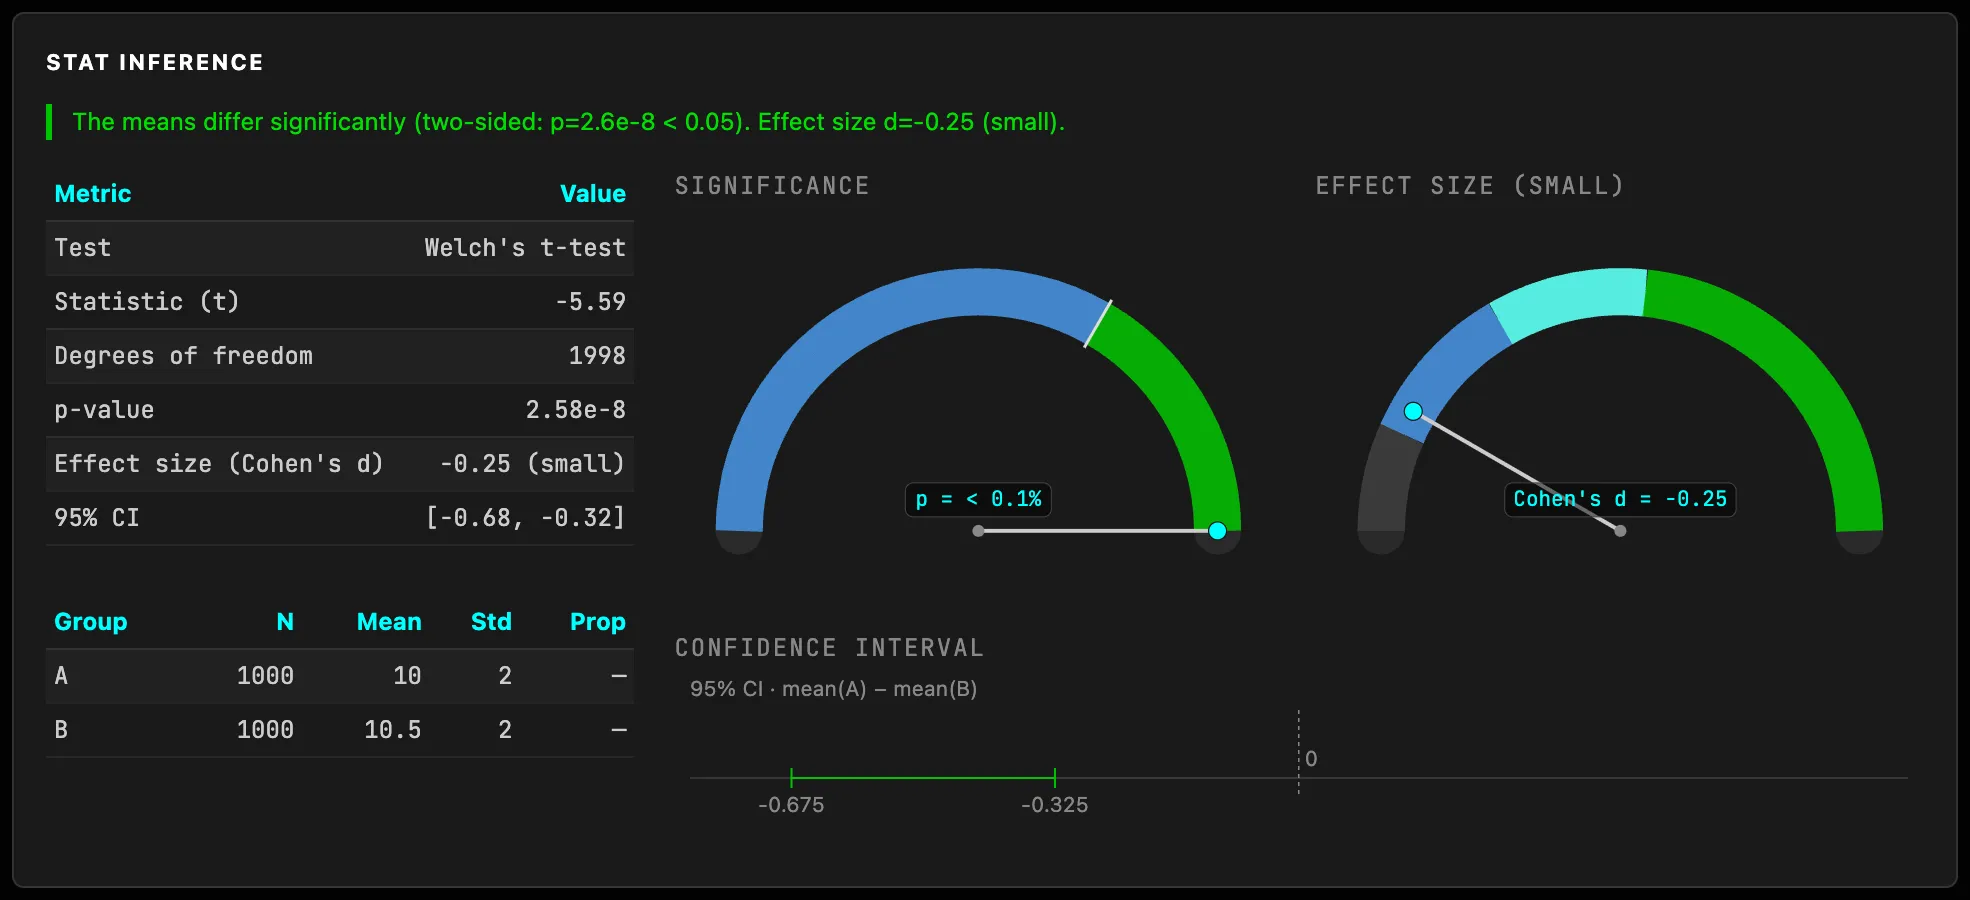
Statistical Inference compares two means or two proportions, on independent groups or on pairs (before/after, A and B on the same units), parametric or non-parametric. The result gives the verdict, the p-value, the effect size and the confidence interval, with gauges that separate what is significant from what matters. Power mode computes the sample size needed, or the power reached, before a campaign starts.
Quick Inference runs the same tests without a file: you type each group's sizes, means, rates or counts, as in an A/B test calculator, and get the result the row-level data would give.
Describe what sets a group apart
The Advanced Stats tab moves to several variables at once. The correlation tables measure how each variable relates to a target, which helps choose a model's variables. Profiling describes each group (segment, target, cluster, score quantile) by its over- or under-represented values and categories, with lifts and information value, and takes a control group into account when there is one. Use Complement compares each group with the rest of the population rather than with the whole, which brings small groups out.
Find the categories that go together
Association rules look for the combinations of categories that come with a category of interest, filtered by support, confidence and lift. A high lift marks a useful rule: the category of interest comes up clearly more often when the others are present.
Try it on your own data
Everything runs in your browser: your data never leaves it.
Open TetrachoreUpdated 6 November 2026