
Data exploration
Plan : FreeRead a projected data cloud, and know what the projection shows faithfully and what it hides.

Business problems
- Check whether computed groups match a category the business already knows.
- Spot the points that stand out without writing one query per criterion.
- Isolate a subset by hand and turn it into a group reusable in the analyses.
Academic problems
- Show that a projection distorts, and on which points exactly.
- Read two qualitative variables at once on the same cloud, through colour and shape.
- Show a Simpson's paradox: per-group lines sloping against the overall line.
Methods & guarantees
- Two-stage scaling, columns then rows, before projection.
- Slope and r² computed on the raw column values: they do not move when the camera turns.
- Filtering reads either the original coordinates or the projected ones.
Colour and mark points by what sets them apart
Five roles can give a point its colour, stacked by priority: hand-drawn groups, then cluster, target, treatment and segment. A point with no manual group takes its cluster's colour, and so on down the list.
Shape By encodes a second role through the point's shape. Two qualitative variables can then be read at once: here, colour tells the cluster found from the chemistry, shape tells the wine's actual colour.
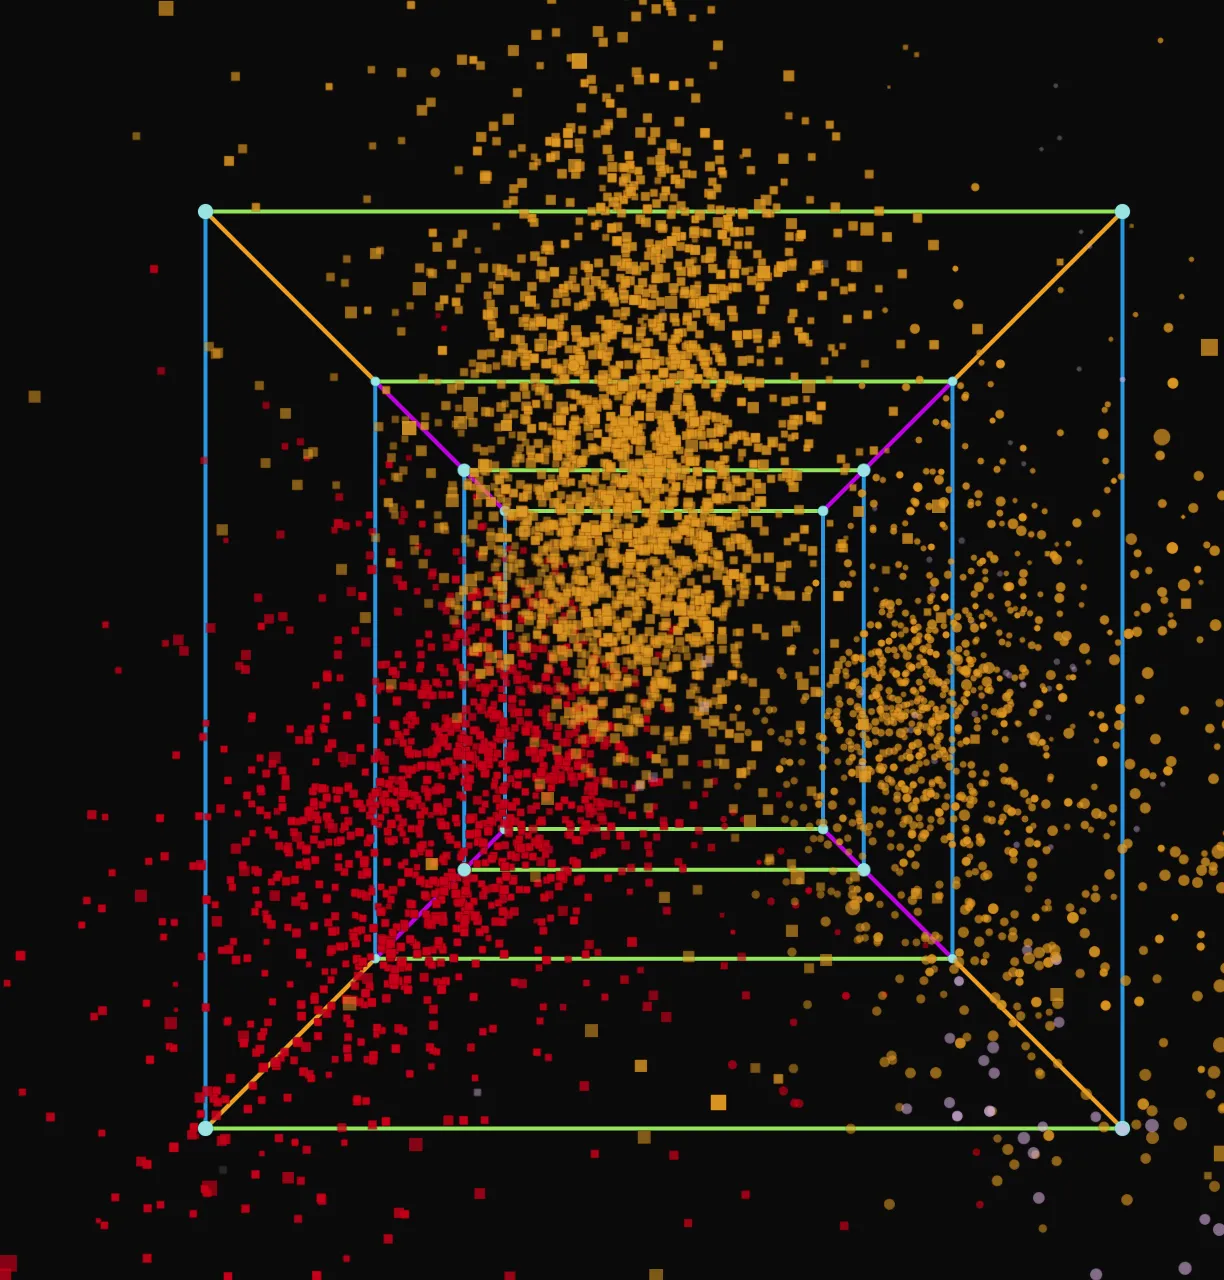
Know which points the projection shows faithfully
Projected from twelve dimensions onto three axes, a cloud stacks on screen points that lie far apart in the hidden dimensions. Enable Dim Fading fades the points whose position is carried mostly by those invisible dimensions: a solid point is where it seems to be, a faded one is not. Show hidden-mass reverses the reading to isolate the misleading points.
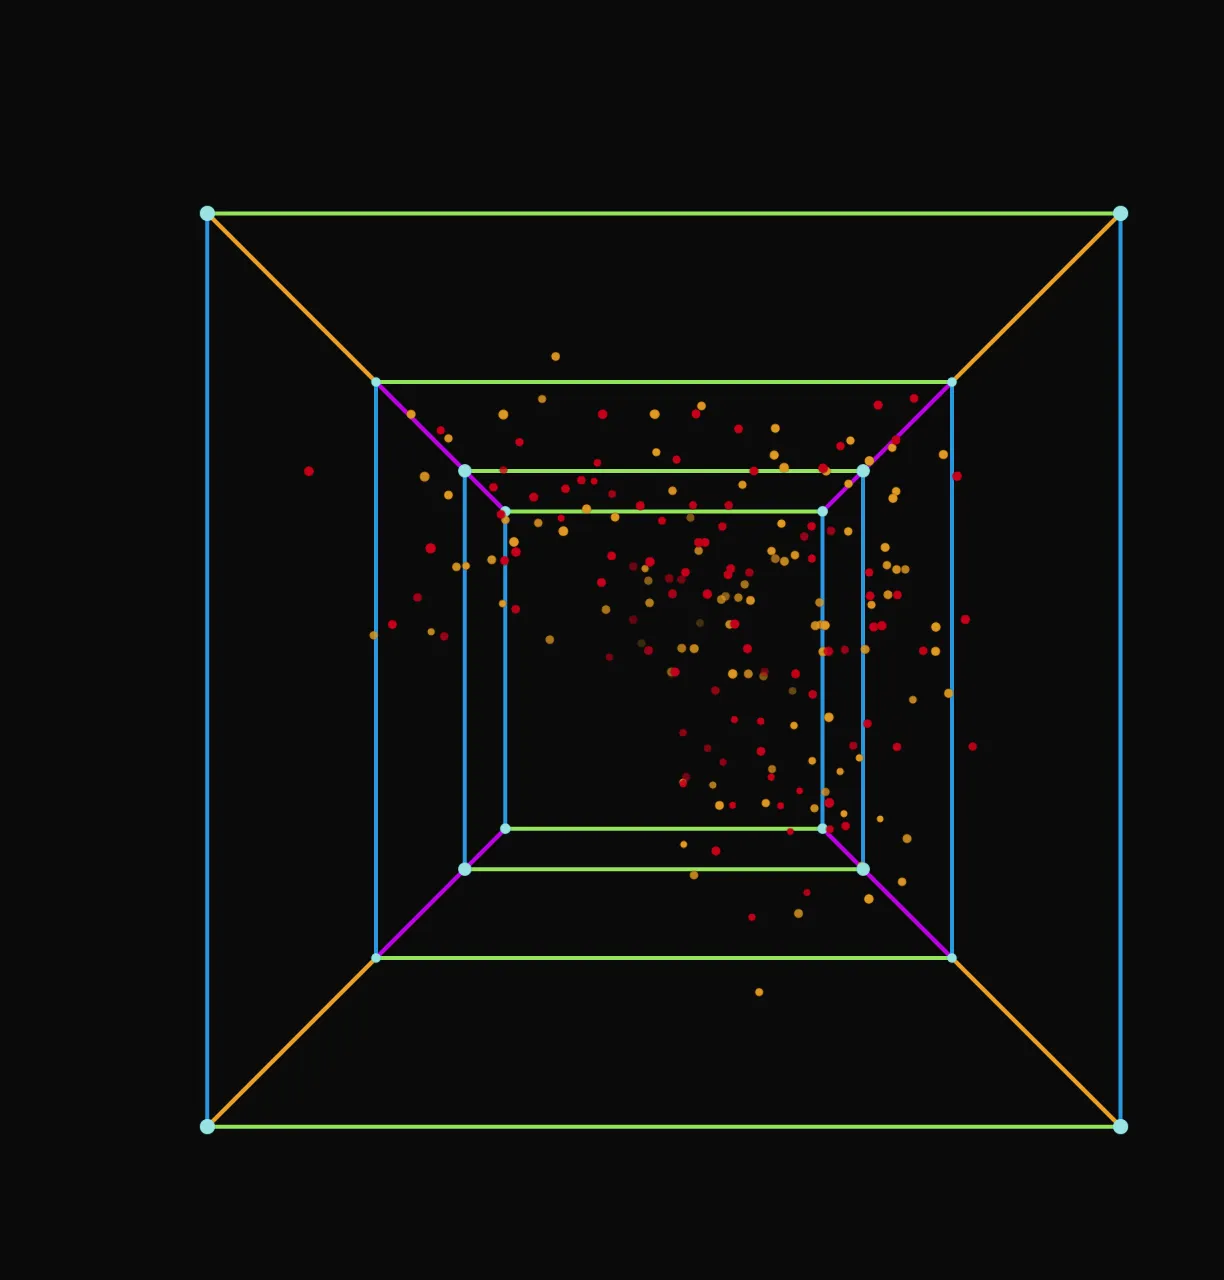
Filter, enclose, select
Filtering combines three sets of criteria: labels (Show, Hide), groups, and axis values read at the chosen pipeline stage. An orbital encloses the core of the cloud in every dimension at once, as a Gaussian ellipsoid, a quantile box or a quantile ellipsoid; Inside | Outside counts the points on each side.
In Select mode, a rectangle captures points, and the Manual Groups block turns them into a group. The Search & Filter window finds a point by name without leaving the scene.
Read a relationship between two axes, or a threshold
Bivariate Fit draws a regression line, its confidence band and a dispersion ellipse on the projected cloud, overall or per class. Reference Lines places a mean, a zero or a threshold on an axis, and a target band with a count of the rows inside it.
Valences link each point to its nearest neighbours, in the original space or in the scene, and trajectories link the points of a same group in chronological order.
Try it on your own data
Everything runs in your browser: your data never leaves it.
Open TetrachoreUpdated 2 November 2026