
Factor analysis
Plan : Free · Hyper optionsSum up dozens of variables in a few readable axes, and know which points those axes represent faithfully.

Business problems
- A customer file has too many columns to make out any profiles.
- A survey mixes numeric answers and multiple-choice answers, and no classic method takes them together.
- Two sources describe the same people, and one drowns out the other as soon as they are analysed together.
Academic problems
- Teach PCA, MCA and their interpretation aids on real data, in three or four dimensions.
- Pick the method from the nature of the variables, up to discriminant analysis on qualitative or mixed data.
Methods & guarantees
- Contributions and cos² of individuals and variables, axis by axis.
- New rows projected onto an already calibrated model, without refitting it.
- In MFA, each block of variables is weighted so that none dominates just because of its size.
Pick the method that fits your data
The Method menu covers the common cases. PCA (principal component analysis) for numeric variables, MCA (multiple correspondence analysis) for categorical ones, FAMD (factor analysis of mixed data) for a mix of both, MFA (multiple factor analysis) for variables organised in thematic blocks. LDA (linear discriminant analysis) separates known groups using a target variable, and its variants MCA+LDA and FAMD+LDA (Saporta's "Disqual" method) extend it to qualitative or mixed data.
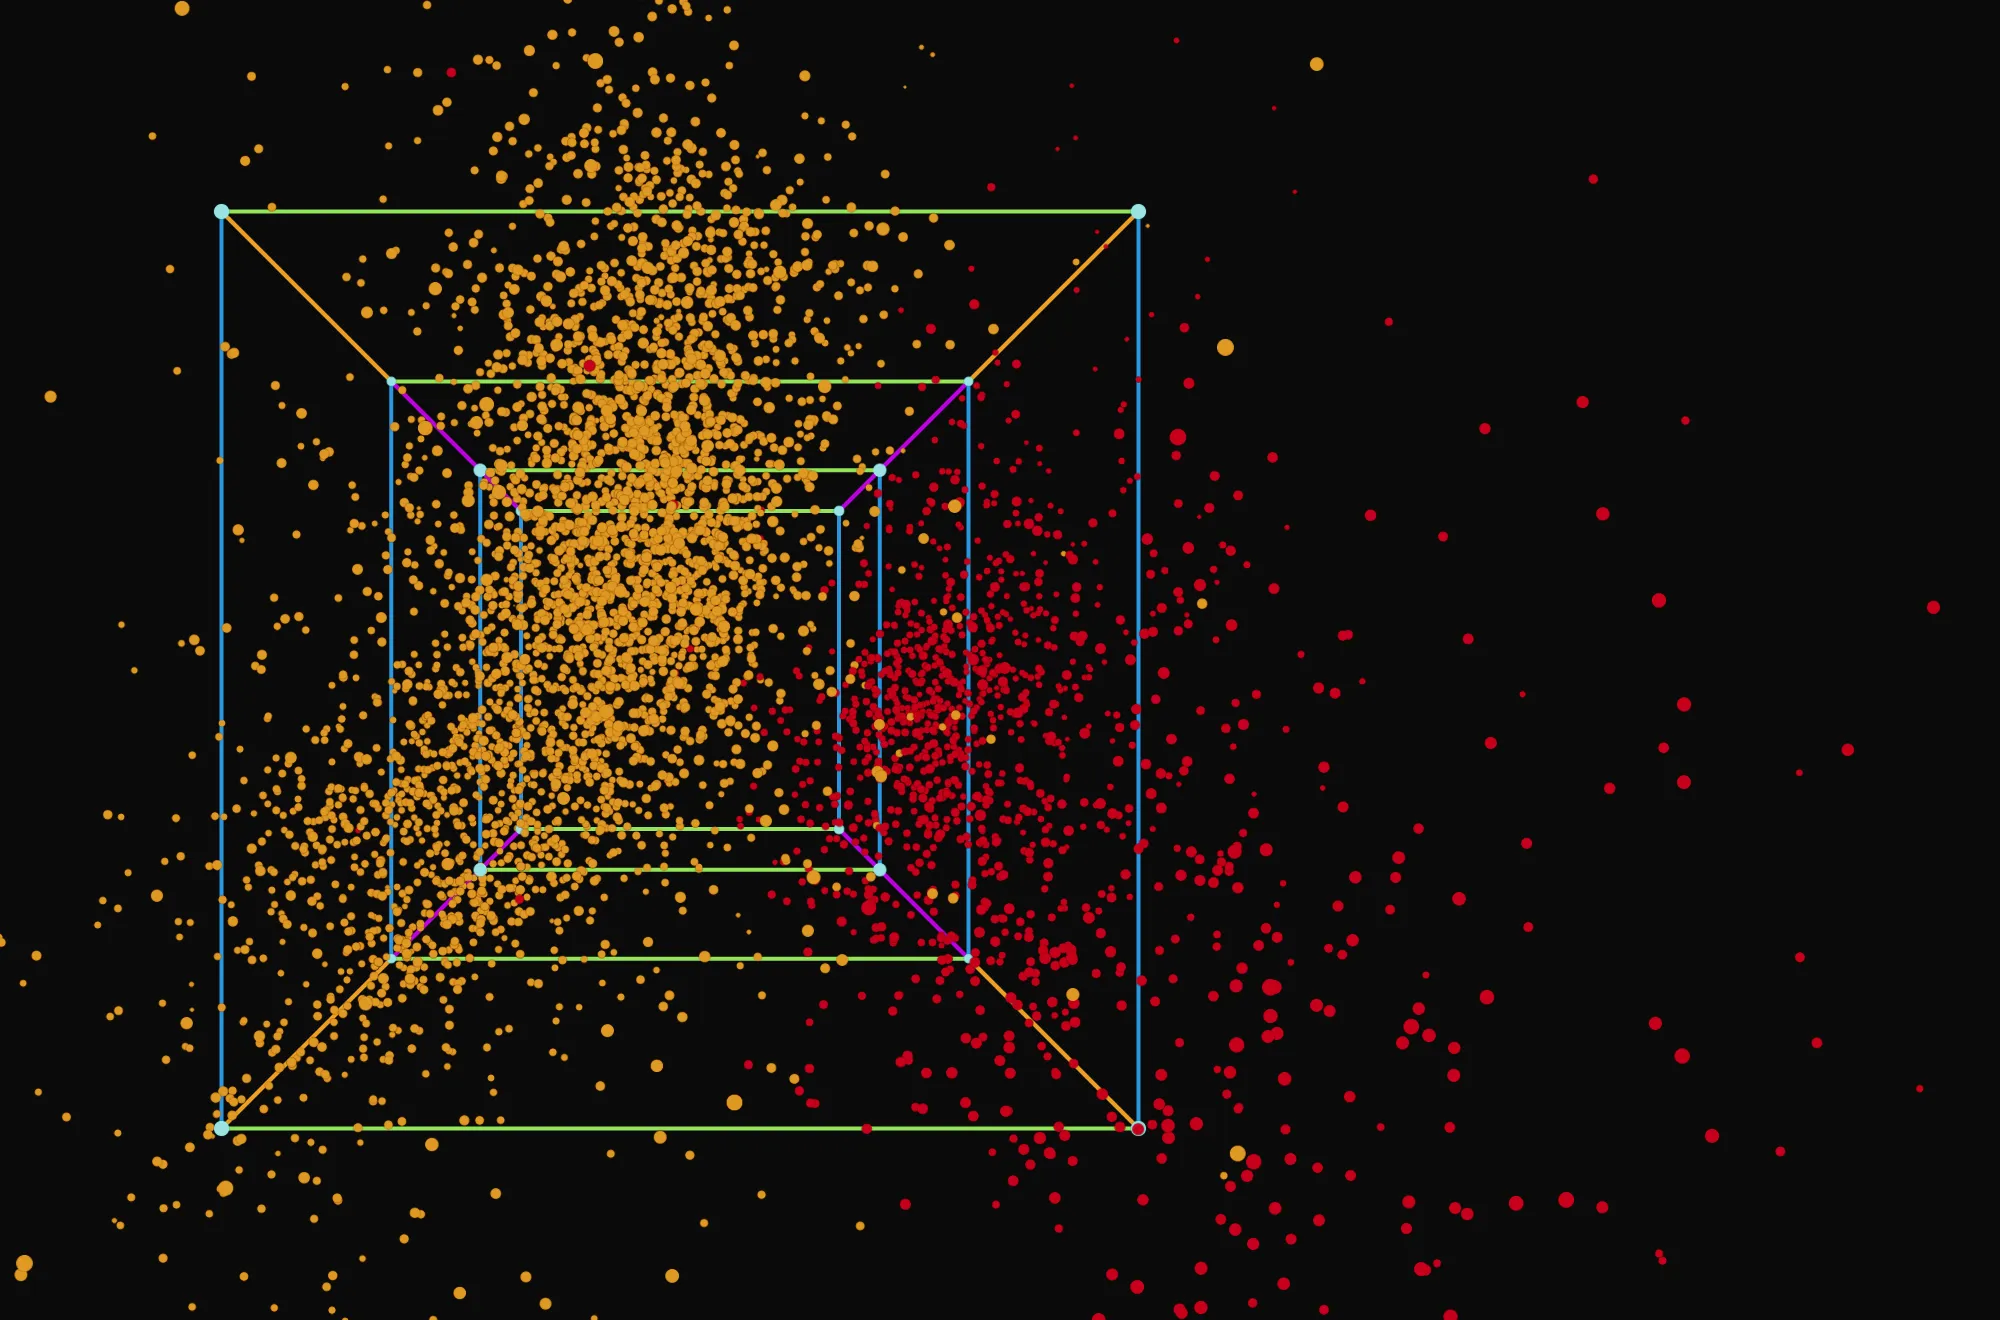
Run Factor runs the projection. The individuals then appear in the scene, the first factor axis on X, the second on Y, and so on up to W, V5, V6.
Know what an axis means, and which points it represents well
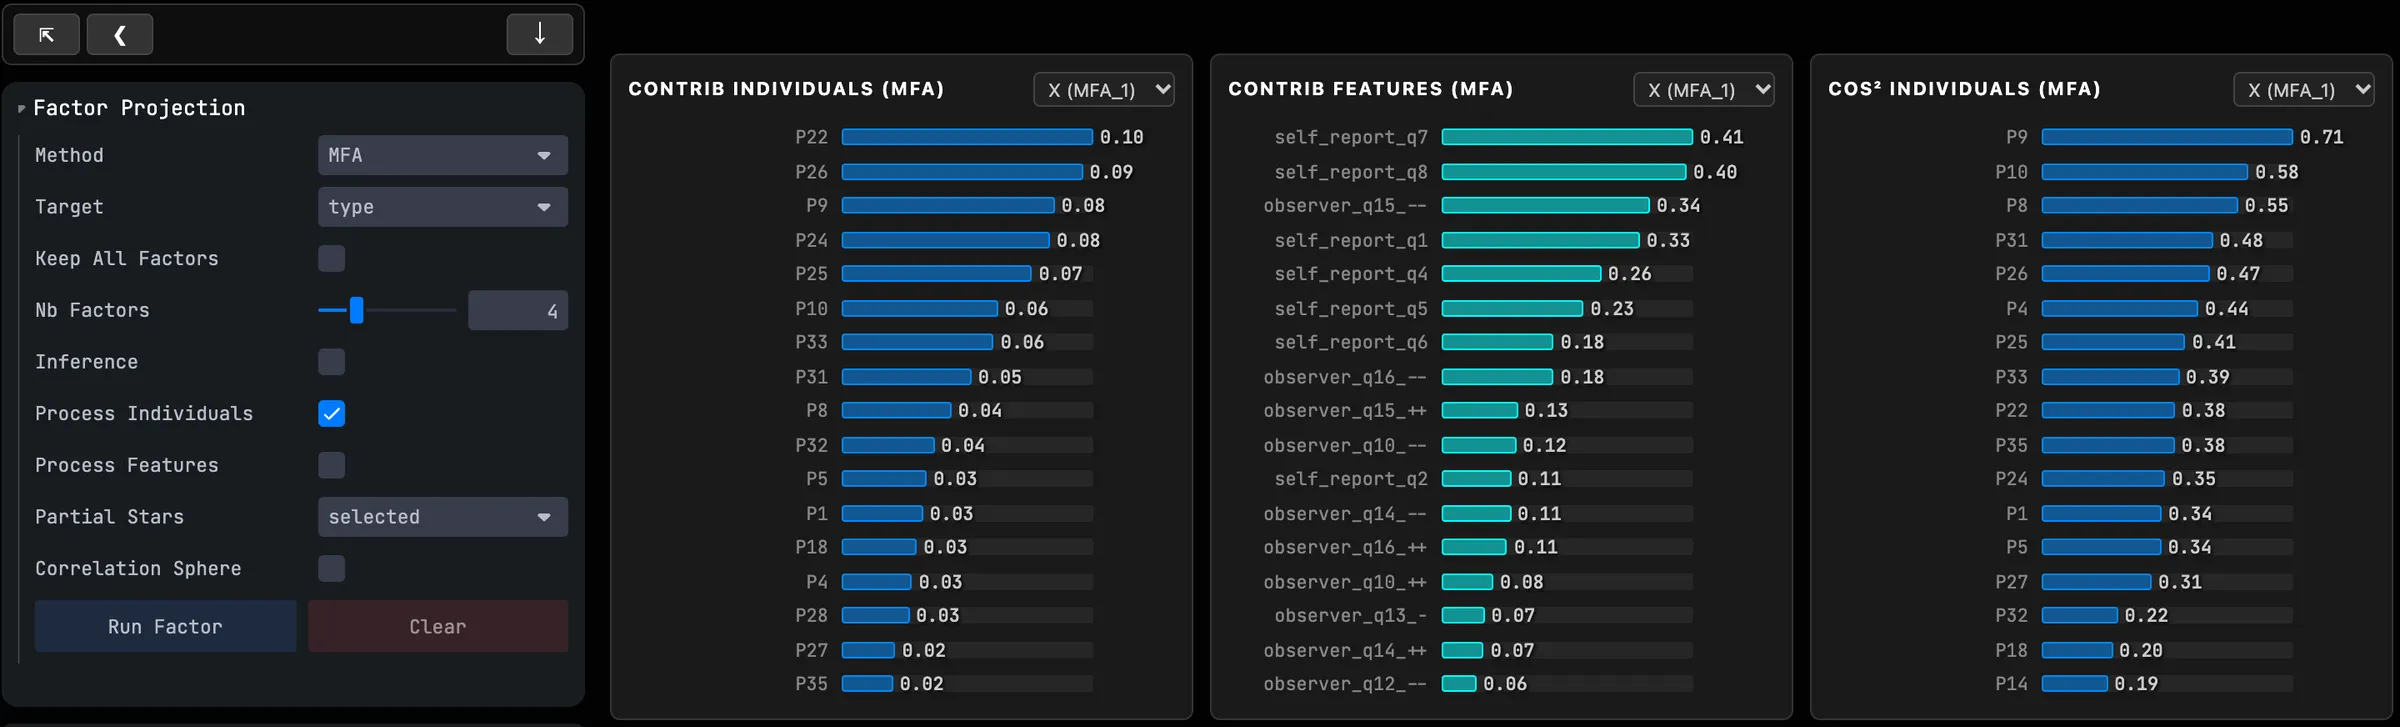
A factor axis only means something once you know what builds it. The tab shows, axis by axis, the contribution of individuals and variables, and their squared cosine: a point with a high cos² is well represented on that axis, and its projected position stays faithful.
Correlation Sphere adds a unit sphere in the variable space: a numeric variable close to its surface is well rendered by the three displayed axes, a variable close to the centre is not.
Combine several sources without one drowning out the others
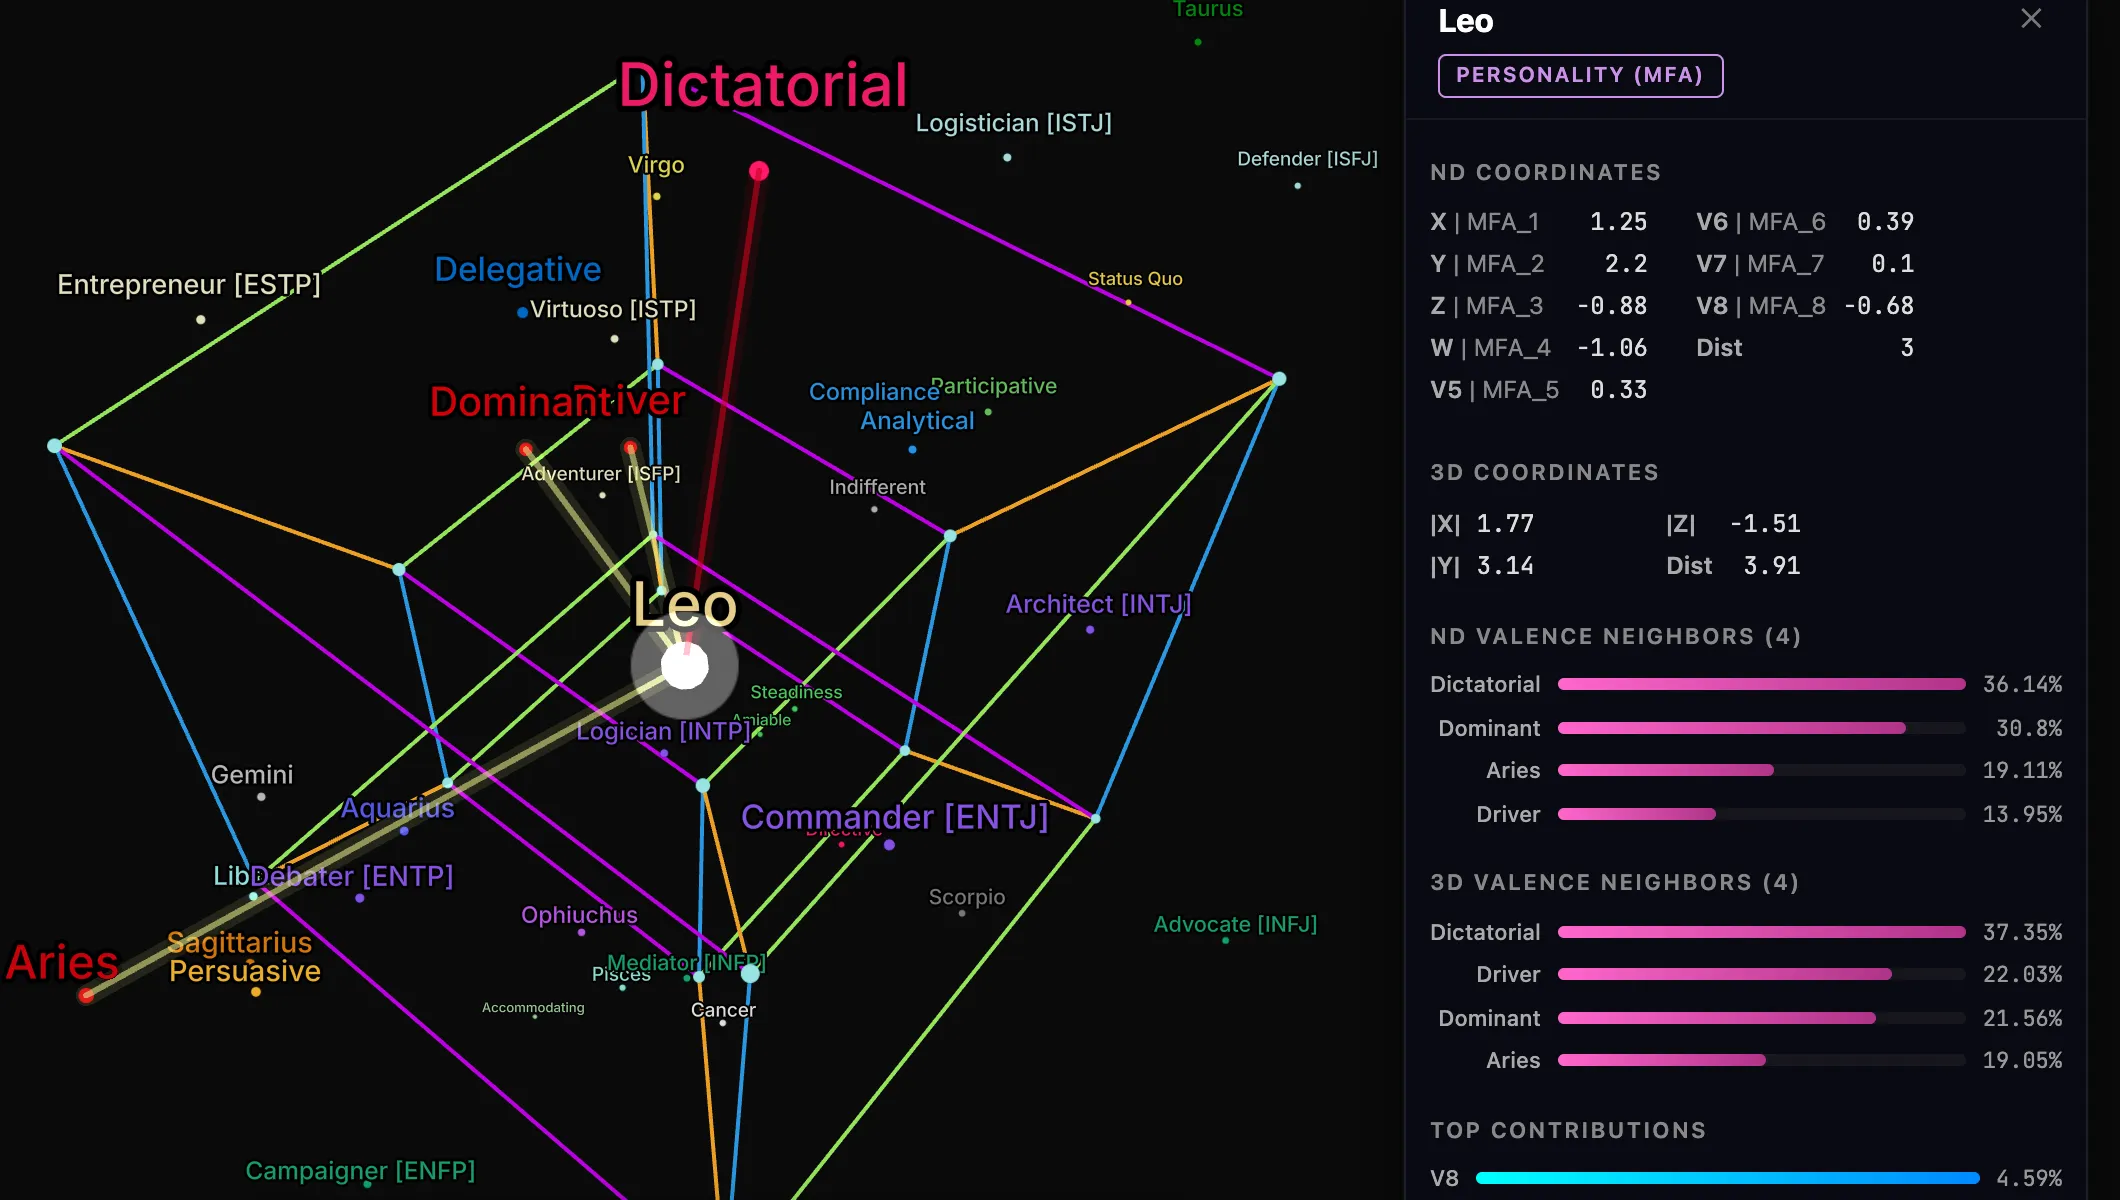
When variables come from different blocks, for instance a self-assessment and an observer's view, MFA weights each block so that it counts as much as the others. Partial Stars then links each individual to its partial positions, one per block: a long star flags a person the sources disagree about.
Project new data onto an existing model
Inference applies the projection matrices of an earlier analysis to new rows, instead of refitting it. The new points land in the same space as the old ones and remain comparable.
Hy-Personality, a demonstrator to try for yourself, inspired by behavioural profiling frameworks (MBTI, DISC, astrology, etc.)
Hy-Personality applies these methods to an 18-question questionnaire. Your answers are projected by PCA, MCA or MFA into the same space as reference profiles drawn from well-known frameworks (DISC, MBTI, Social Style) and the lexical descriptions of the zodiac. It is not a psychometric tool: it is a visual demonstration of how close these vocabularies are.
Try it on your own data
Everything runs in your browser: your data never leaves it.
Open TetrachoreUpdated 7 November 2026