
Marketing Mix Modeling
Plan : HyperSplit revenue across media channels, and know when not to trust the attribution.

Business problems
- Know which share of revenue each media channel brings, and at what ROI.
- Spot the saturated channel, where one more euro brings almost nothing.
- Model spend and sales without handing them to an agency or a cloud.
- Feed the result of a geo test or a lift study into the model.
Academic problems
- Teach adstock, saturation and ridge regularisation on a complete weekly dataset.
- Show the difference between attribution by a model and an experimental measurement.
Methods & guarantees
- Geometric adstock with delay, concave saturation, ridge regression with an optional non-negativity constraint.
- Leak-free chronological back-test: transforms, standardisation and priors recalibrated on the training part only.
- Contribution intervals by block bootstrap, VIF per channel.
- Engine compared with Meridian's public simulated dataset; every result carries its engine version and a fingerprint of its configuration.
Attribute revenue to each channel
The model explains a time-based target (Target, weekly revenue for instance) by the spend of each media channel ticked in the panel, a baseline (trend and season) and control columns for known shocks: price, promotions, public holidays. Each spend acts after a delay (Max Delay), keeps acting over several periods (Carryover (max lag)), then saturates. The ridge penalty (L2 Penalty) stabilises channels that move together.
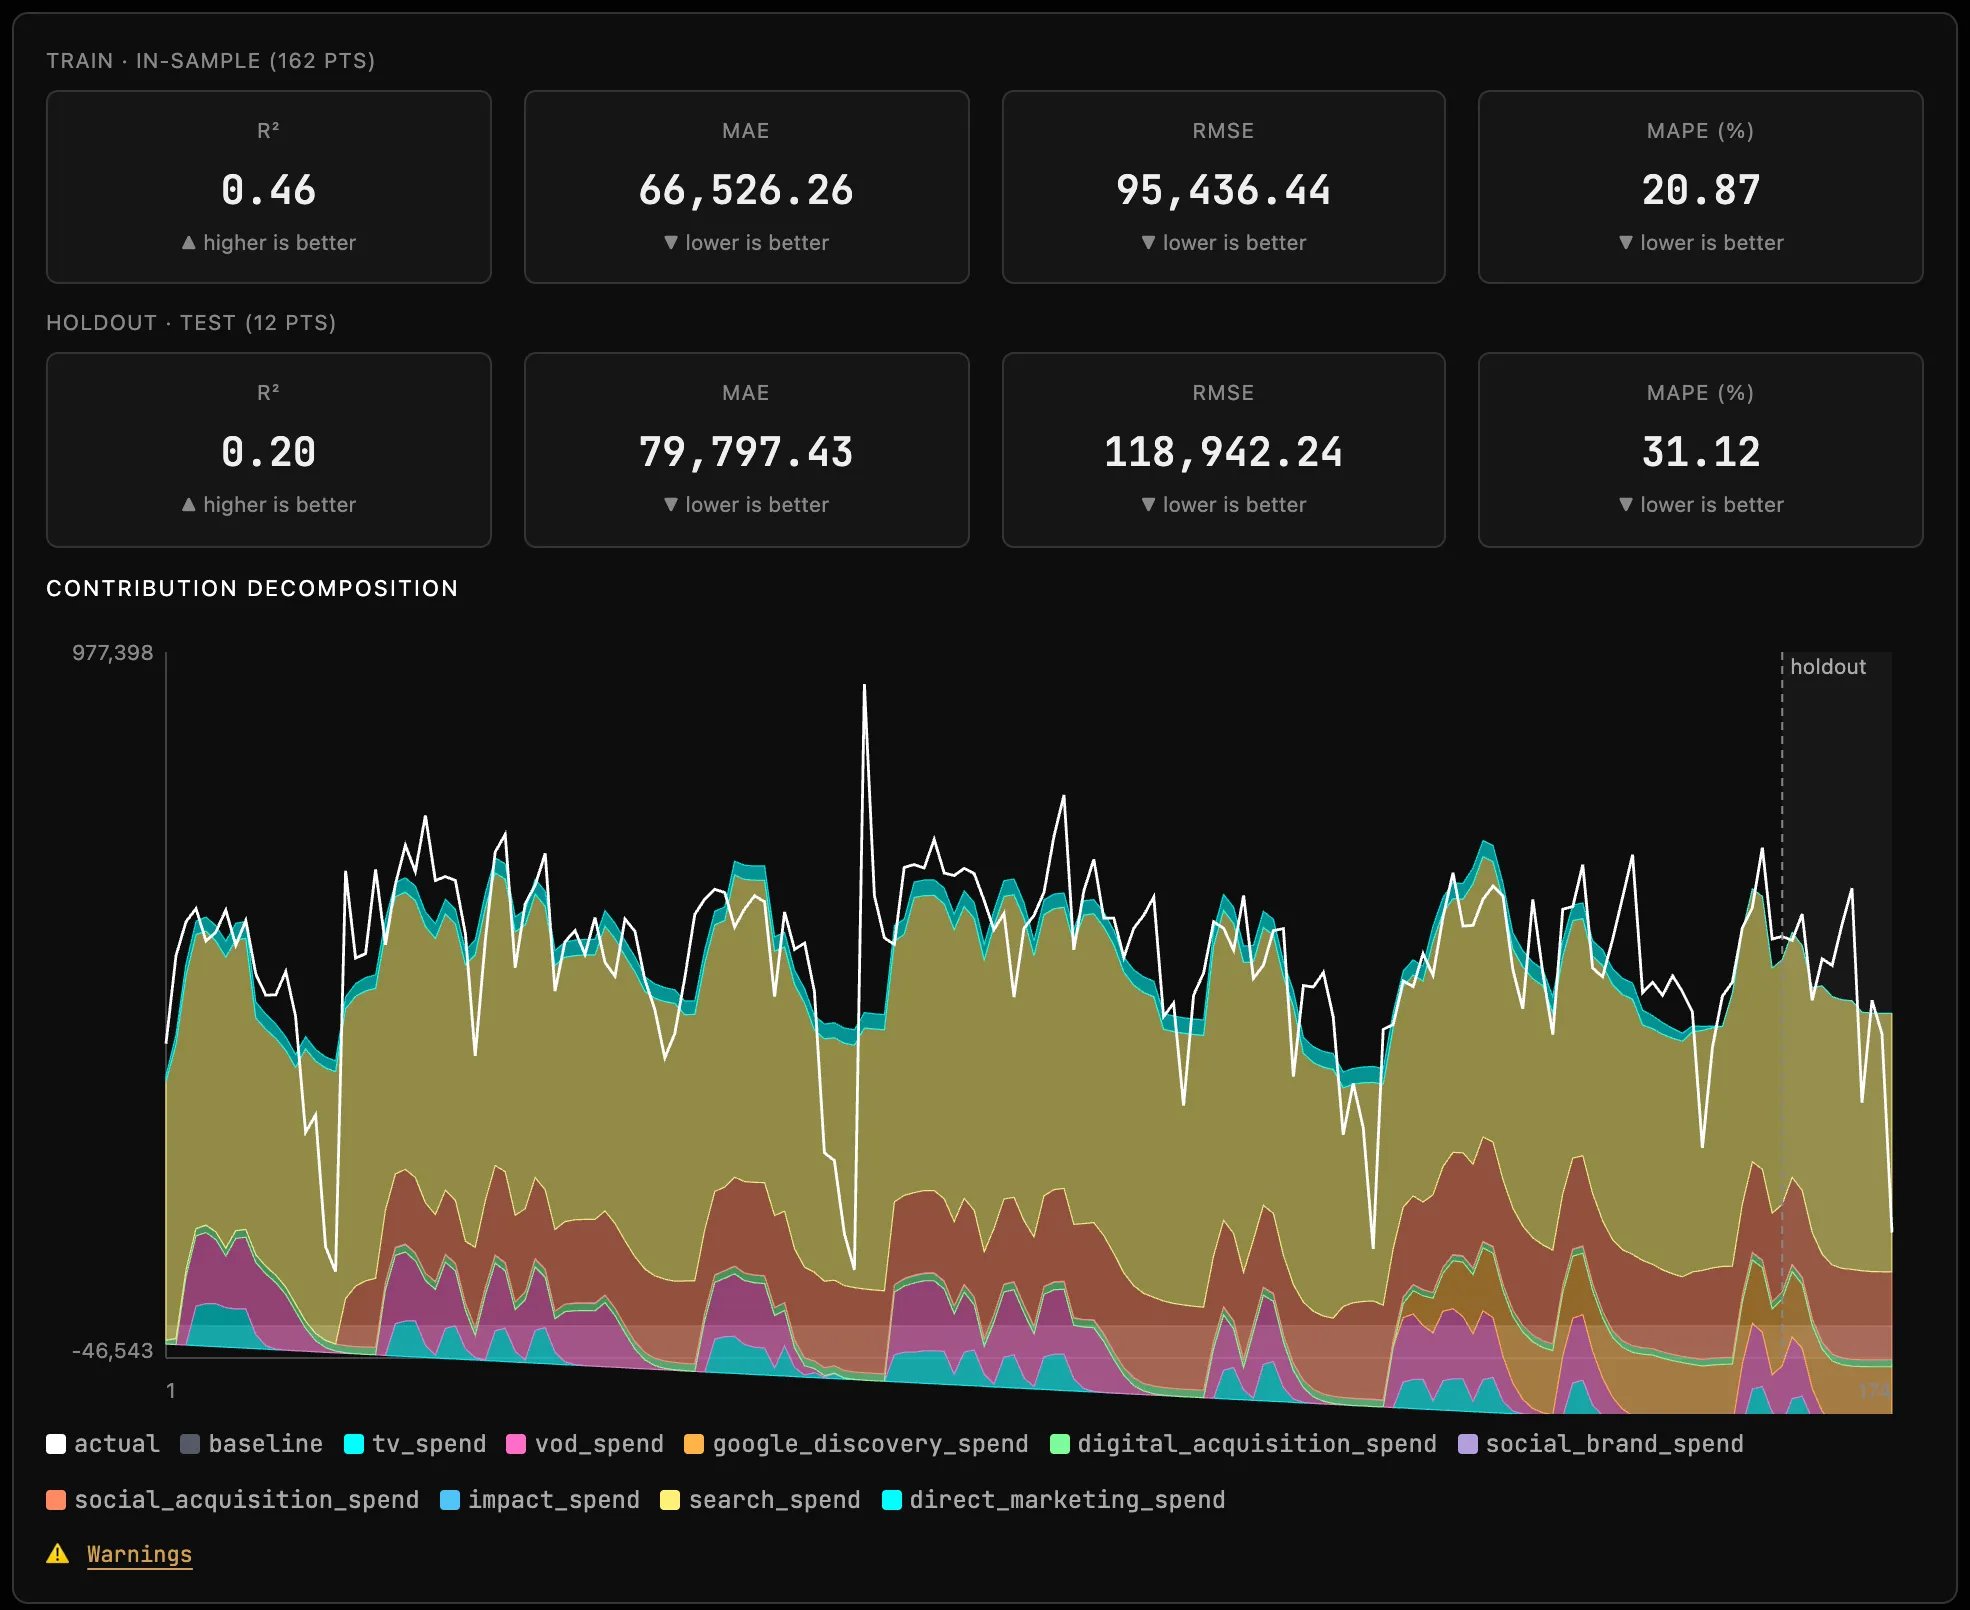
The result breaks revenue down week by week and gives, for each channel, its contribution, its share, its ROI and the interval of its contribution. The computation runs entirely in the browser: spend and sales never leave the machine.
Find where the next euro still pays
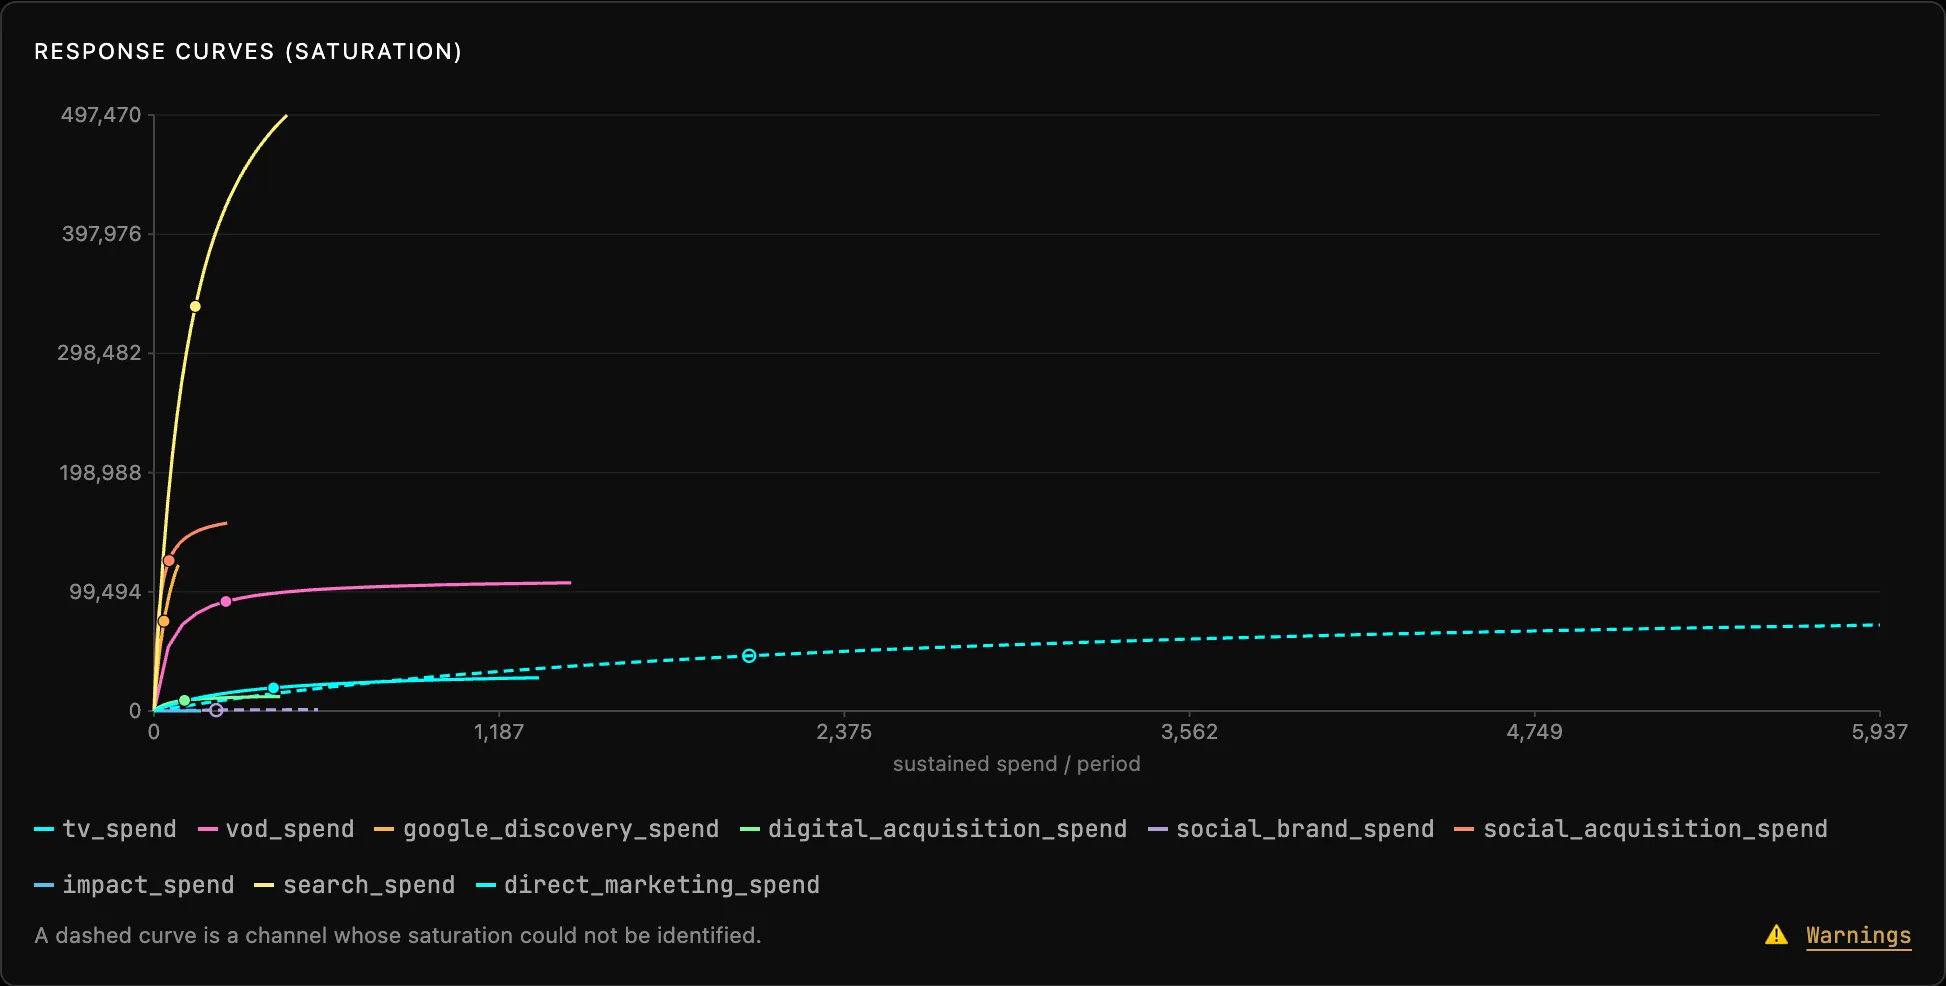
Response curves show a channel's contribution as a function of its spend, with an elbow where it starts to level off. This is where budget trade-offs are read: a channel already on its plateau returns little per extra euro, a channel still on its slope can absorb more. A dashed curve marks a channel whose saturation could not be identified: no elbow is read on it.
Weigh two channels on one surface
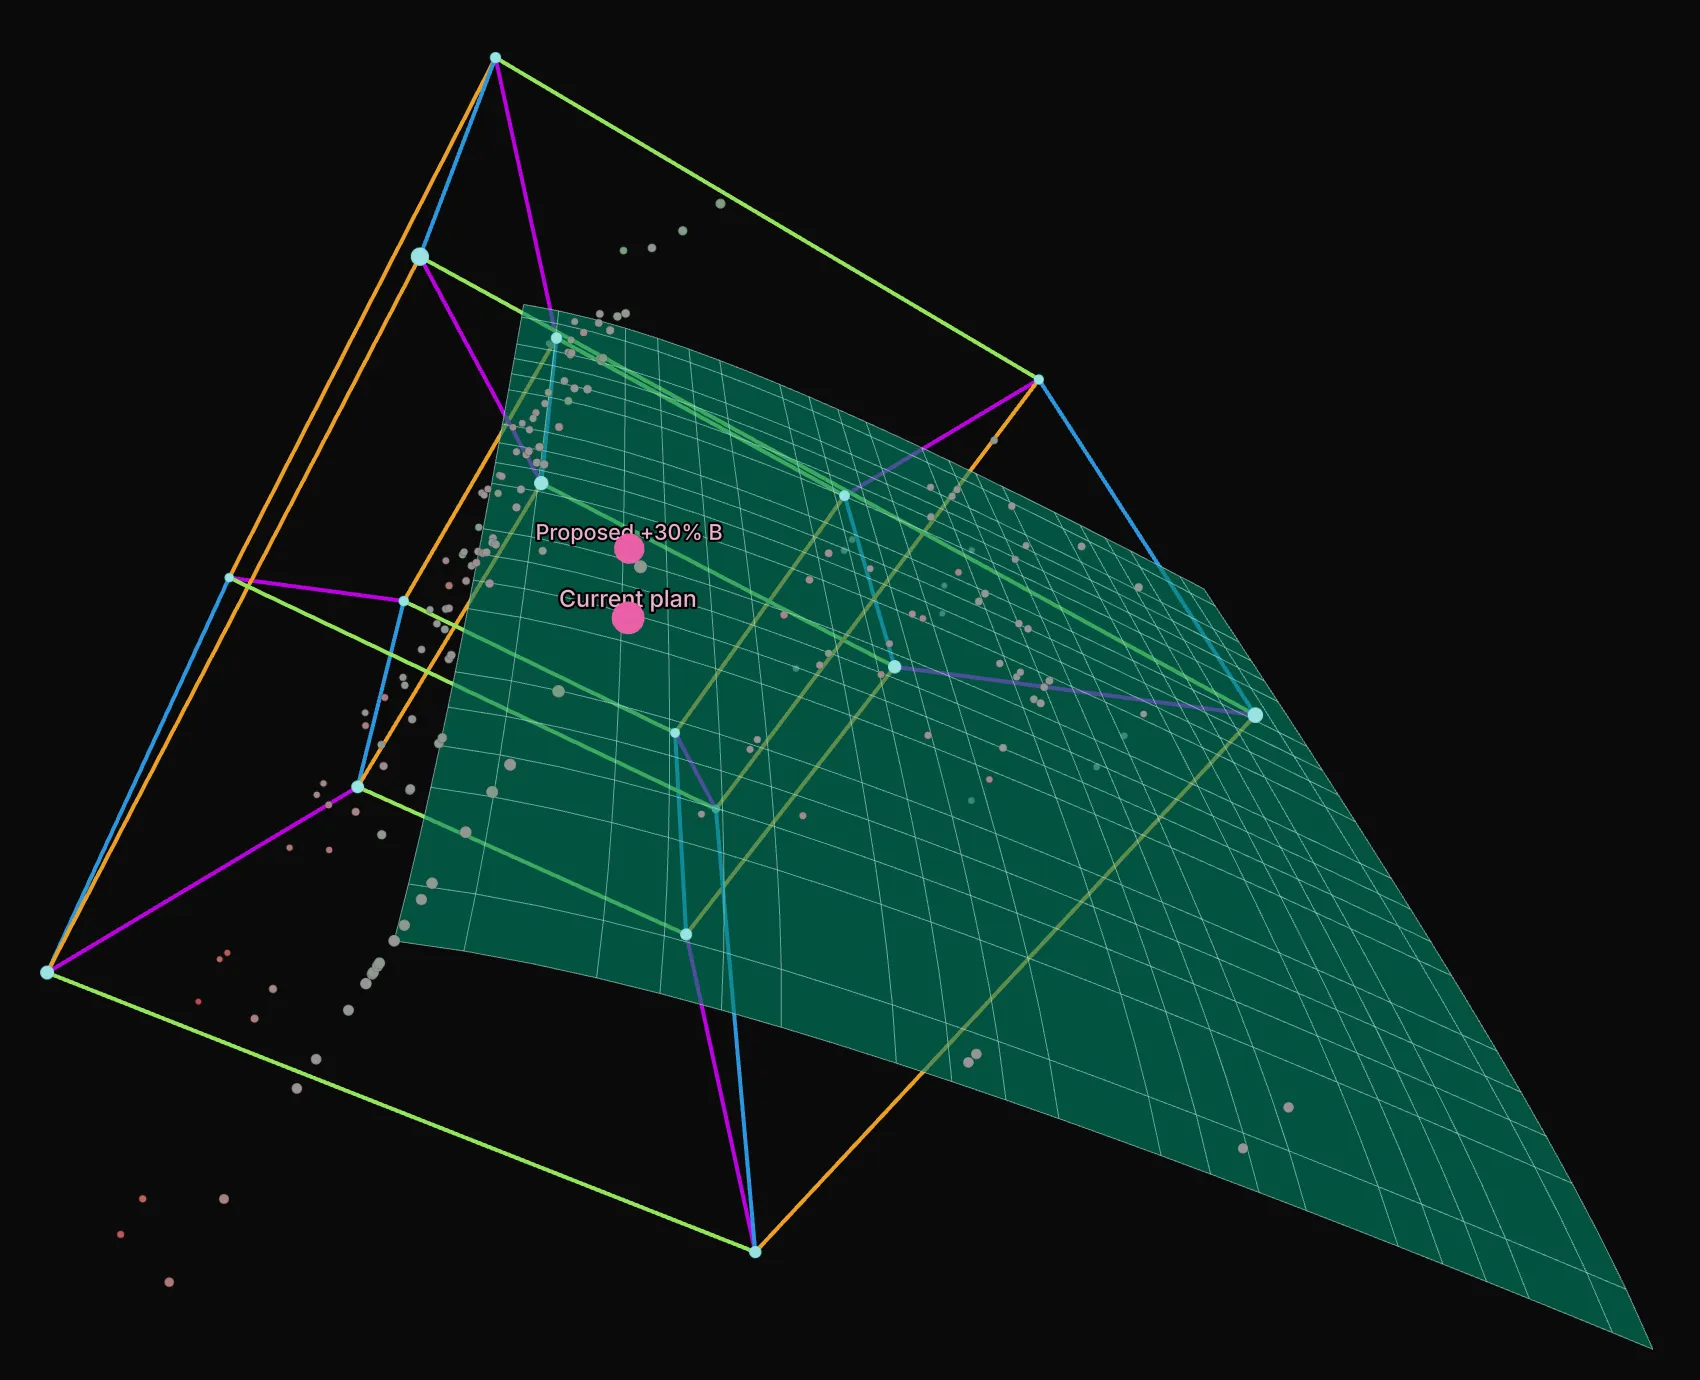
With two channels, the curve becomes a surface. In the 3D scene, predicted revenue rises above the plane of the two channels' spends: where the surface flattens, the channel saturates and the next euro earns more elsewhere. The observed weeks sit around it, at their actual revenue, and labelled spend plans (Scenario Points) are compared directly on the surface.
Know when not to trust the model
An MMM reads correlations over time: it is the best consistent explanation of the history, not a causal measurement. The module says so instead of hiding it. The back-test (Holdout) is chronological and leak-free: read the error on the last weeks first, the training R² being only a sanity check. Reliability Bootstrap gives each channel an interval, and the robust mark when its contribution stays above zero from one resample to the next. A VIF above 10 means a channel's share cannot be separated from that of correlated channels. Run notes flag a series that is too short (fewer than 52 periods), an irregular cadence, a channel with constant spend, a season covered only once.
Bring in what you already know
When experimental measurements exist (geo tests, lift studies), ROI priors bring them into the model: an expected ROI per channel, and a weight that sets its strength against the data (Prior Weight, then one weight per channel). This is the frequentist counterpart of Meridian's Bayesian priors. Same data, same configuration, same engine version: same result, checkable against the fingerprint shown below the charts.
Try it on your own data
Everything runs in your browser: your data never leaves it.
Open TetrachoreUpdated 7 November 2026