
Clustering
Plan : FreeLet the data form its own groups, then check in space that they hold.

Business problems
- Segment a customer base without fixing in advance either the number of segments or their boundaries.
- Apply the same segmentation to new customers every month, without recomputing it.
- Know whether two segments are truly distinct, or only split apart by the algorithm.
Academic problems
- Compare K-Means and hierarchical clustering on the same data, with dendrogram and metrics.
- Set groups found without labels against a known classification.
Methods & guarantees
- Isolated points set aside in a class of their own (Mahalanobis distance) before partitioning.
- Number of clusters chosen by the silhouette coefficient or the elbow of the inertia curve, within set bounds.
- Silhouette, Davies-Bouldin, Calinski-Harabasz and Dunn to judge the resulting partition.
Find families you never defined
K-Means is a fast partitioning algorithm when you know in advance how many groups you want. Hybrid, by contrast, segments the data when the optimal number of clusters is unknown. The hybrid method derives from mixed classification: a first K-Means cuts the data into many centres, then a Ward hierarchical clustering merges them, and HCA Auto-Cutoff picks the number of clusters from the silhouette or from the elbow of the between-class inertia curve. A last K-Means (Post-KMeans) reassigns the boundary points to the nearest cluster, and Merging Threshold % merges groups that are too small.
Filter Outliers sets isolated points aside from the start, in a class of their own, so they do not distort the others.
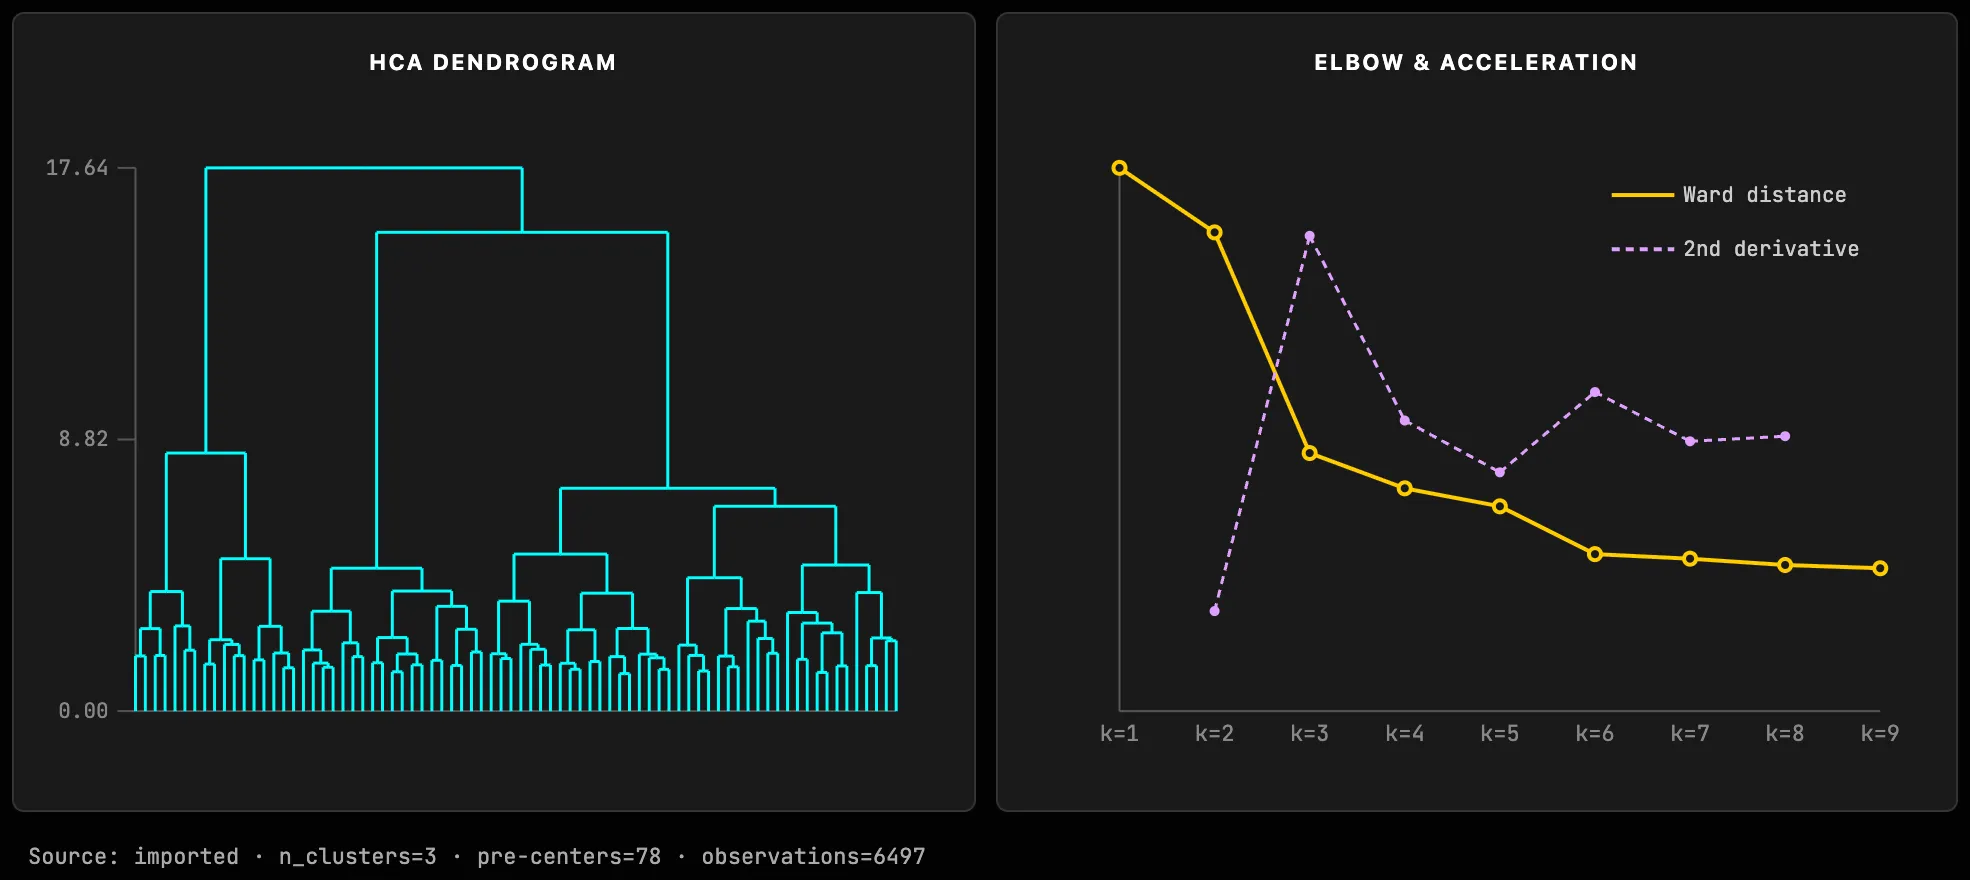
Judge the segmentation before using it
Four metrics score the partition: silhouette, Davies-Bouldin, Calinski-Harabasz and Dunn. Then come the size of each cluster, the distribution of each variable by cluster, and cross-tables with the variables of interest (segment, target, treated group). This is where you check whether groups found without labels match a known classification.
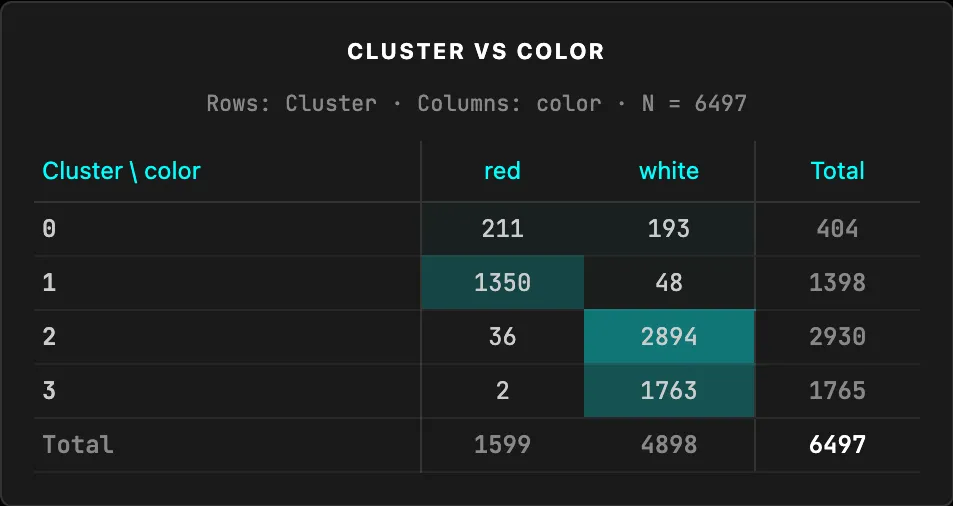
See whether the groups hold in space
Clusters take their colour in the 3D scene, and Show Ellipsoids draws a covariance envelope around each one, sized in standard deviations (k·σ). Two overlapping envelopes signal ambiguous clusters. Rotating the scene shows whether the overlap is real or only an effect of the projection.
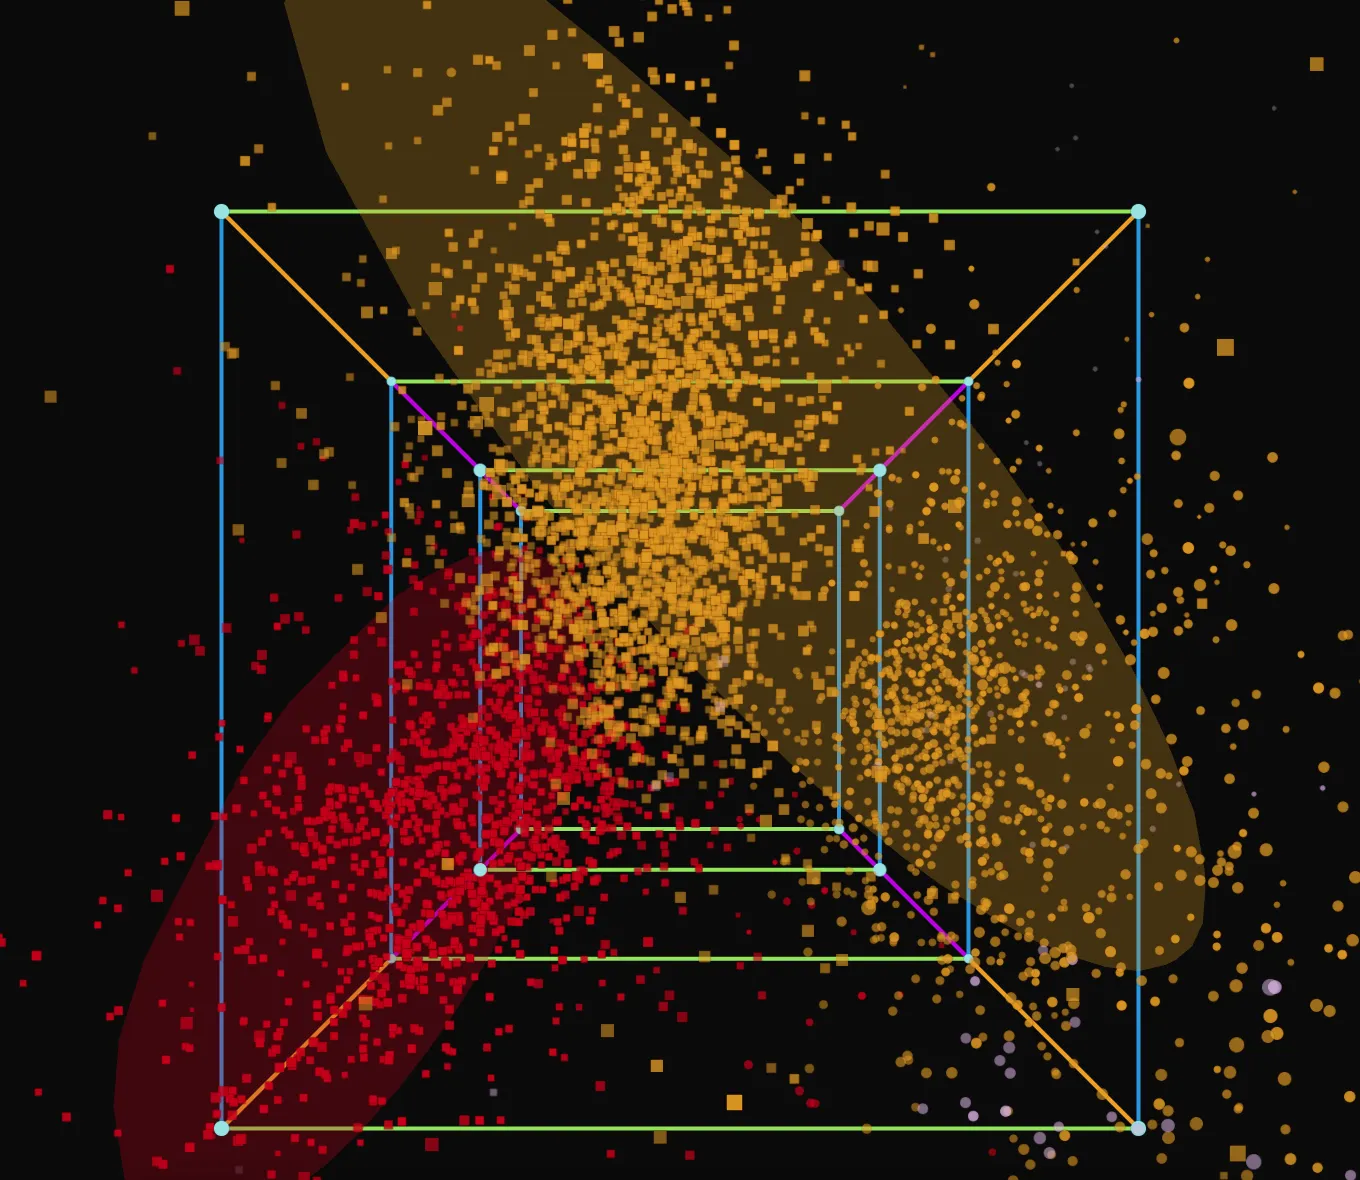
Choose what you group
Clustering runs on the imported data, on the scene's points, on the individuals or variables of a factor analysis, or on Hy-Personality respondents. Standardize puts the variables on the same scale. Partition attaches each point to the nearest reference point, and Reference as Center starts from those reference points as initial centres.
Once the clusters are formed, profiling describes what characterizes each one.
Apply the segmentation to new data
Inference applies an already trained clustering model to new rows, without recomputing it: new customers join the existing segments.
Try it on your own data
Everything runs in your browser: your data never leaves it.
Open TetrachoreUpdated 7 November 2026