
Forecasting
Plan : FreeExtend a series forward in time, and know what the forecast is worth before relying on it.

Business problems
- Anticipate revenue over the coming weeks to set a budget or a stock level.
- Tell whether the dips of a business come from its seasonality, or whether to look elsewhere.
Academic problems
- Teach exponential smoothing and the decomposition of a series into level, trend and season.
- Show that a forecast is judged on periods held out of the fit, not on the history.
Methods & guarantees
- Holt-Winters exponential smoothing, additive or multiplicative seasonality.
- Coefficients α, β, γ found by grid search, or set by hand.
- Chronological back-test: the last periods are removed from the fit, then forecast and compared with the actuals.
Forecast what comes next, and judge it on periods it has not seen
You pick the time column (Time Column, a date or a plain index), the variable to forecast (Target) and the length of a season (Seasonal Period: 12 for months, 52 for weeks), additive or multiplicative (Seasonality). Auto-fit α/β/γ searches for the smoothing coefficients that best fit the history; unticked, you set the weight of level, trend and season yourself.
Back-Test Holdout sets the last periods aside: the model fits without them, then forecasts them. The measured error (MAE, RMSE, MAPE) tells what the forecast is worth on new data, next to the same metrics on the training part. Inference Horizon sets how many periods are forecast beyond the data.
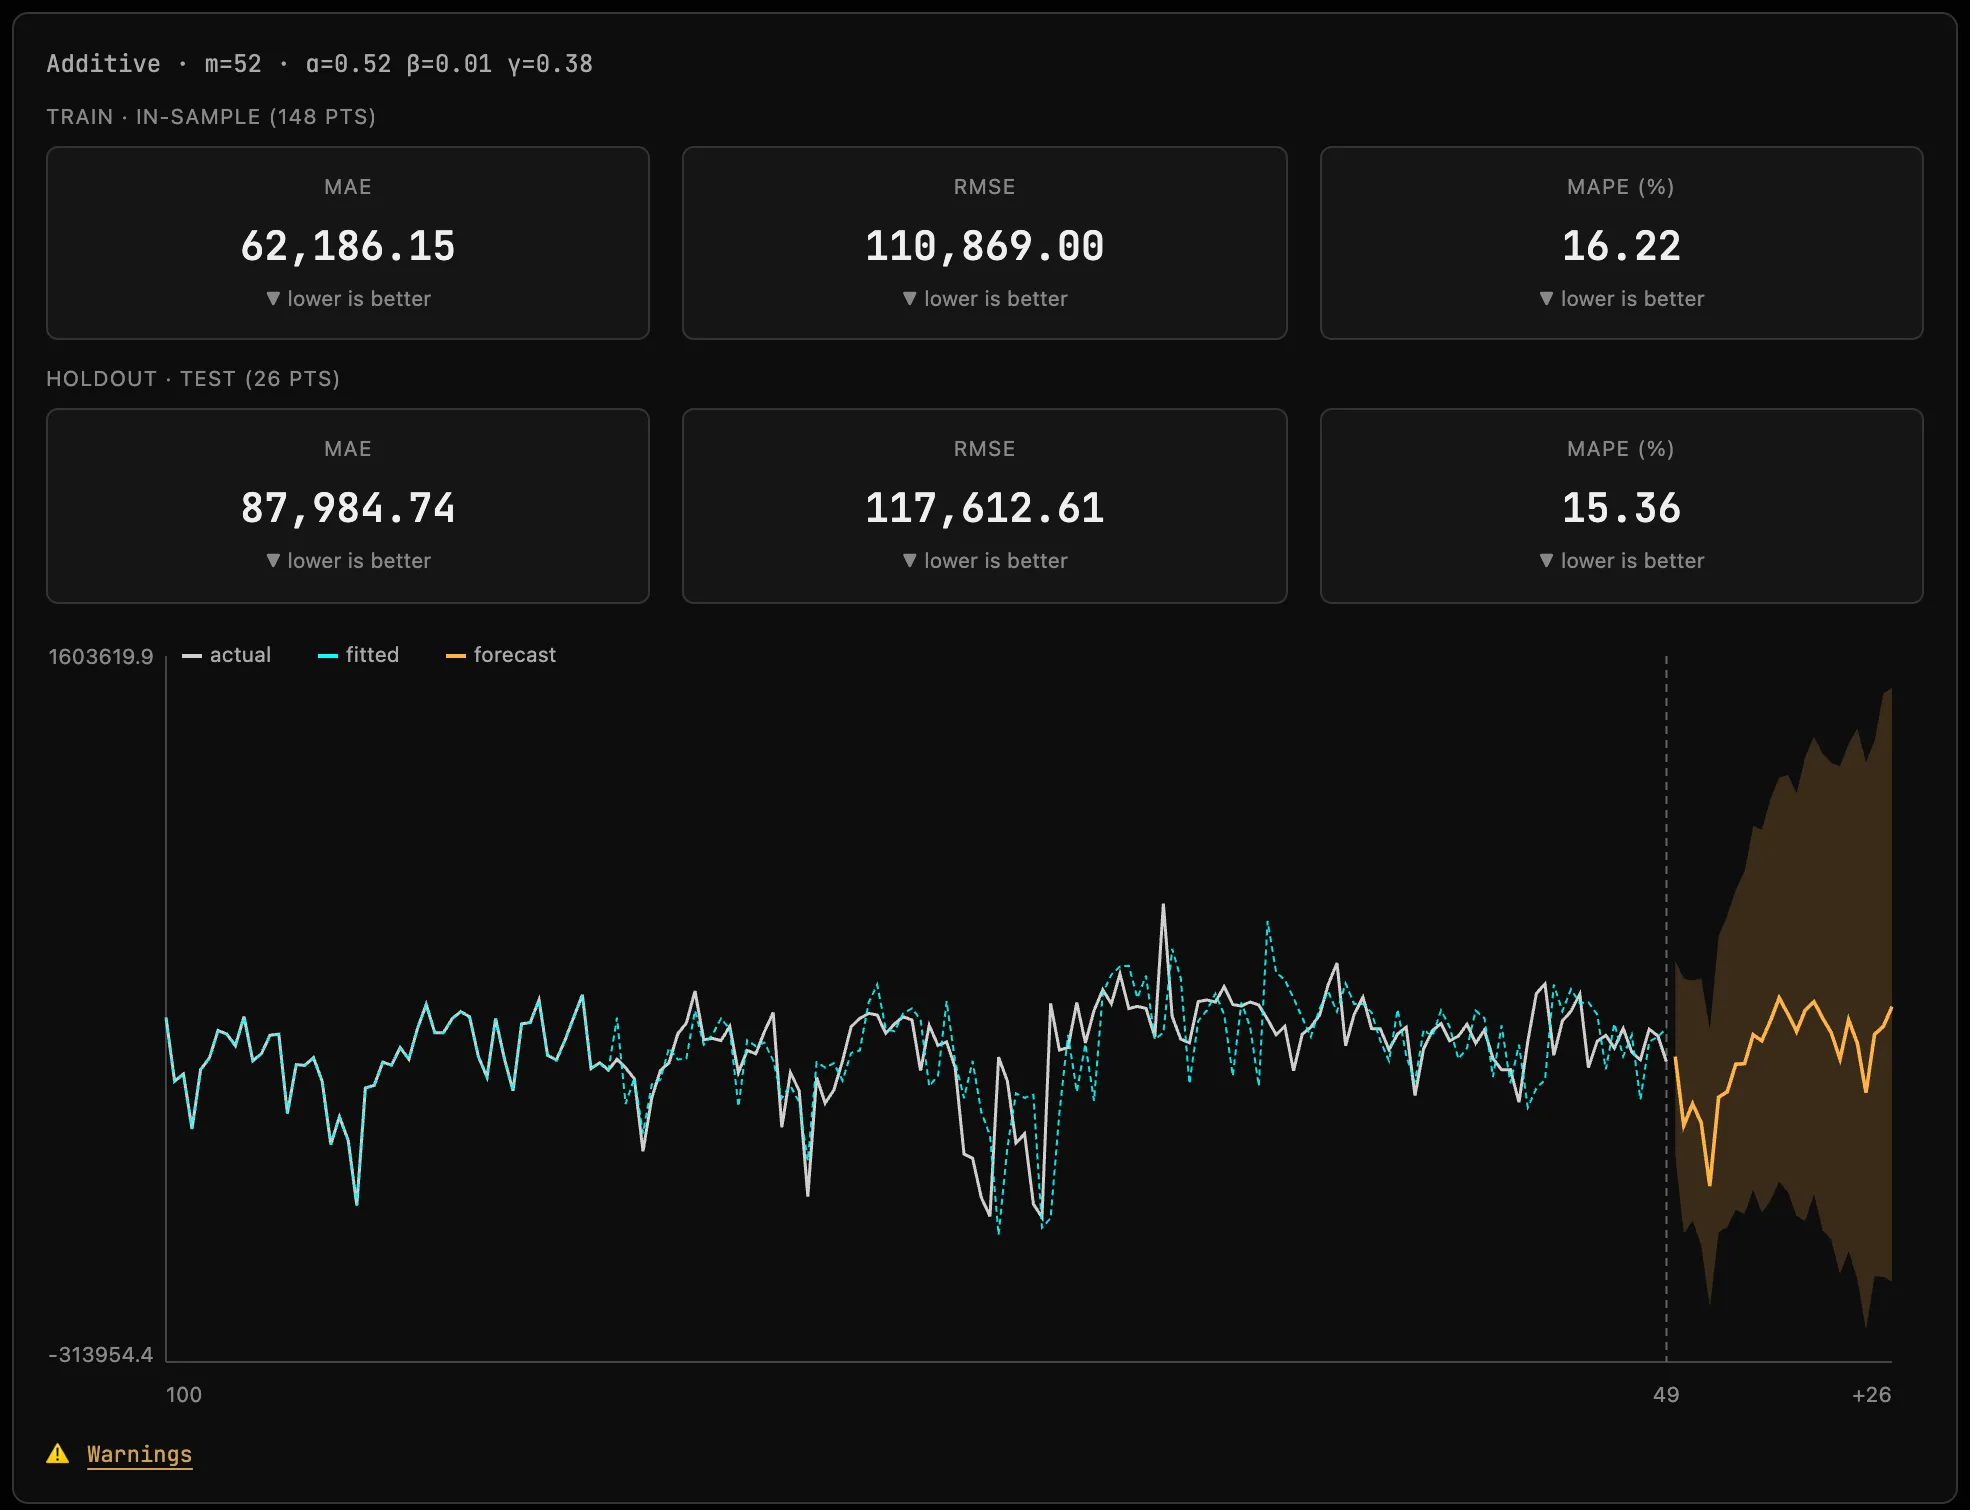
Understand what the series is made of
Below the curve, the decomposition separates the three pillars of the model: the level (the height of the series), the trend (its slope) and the season (the pattern that repeats). It shows whether a drop is a trend settling in or a seasonal dip that will come back. To explain revenue by media spend rather than by its own past, see Marketing Mix Modeling.
Try it on your own data
Everything runs in your browser: your data never leaves it.
Open TetrachoreUpdated 6 November 2026