
Supervised learning
Plan : FreePredict who will respond, and above all who responds because you targeted them.

Business problems
- Rank a customer base by purchase probability and contact only the top of the list.
- Avoid spending a follow-up budget on customers who would have bought anyway.
- Spot the customers a solicitation drives away, before soliciting them.
Academic problems
- Teach the difference between a response model and an uplift model on an A/B test.
- Show why a model is judged on a test sample, not on the rows it was fitted on.
Methods & guarantees
- Missing values replaced by the training mean, the same one for the test set and for inference.
- Uplift through class transformation (Jaśkowski and Jaroszewicz, 2012), with automatic rebalancing of the treated and control arms.
- Qini coefficient as defined by Radcliffe (2007), with the same values as the Python library scikit-uplift.
Predict a response, and judge the model on rows it has not seen
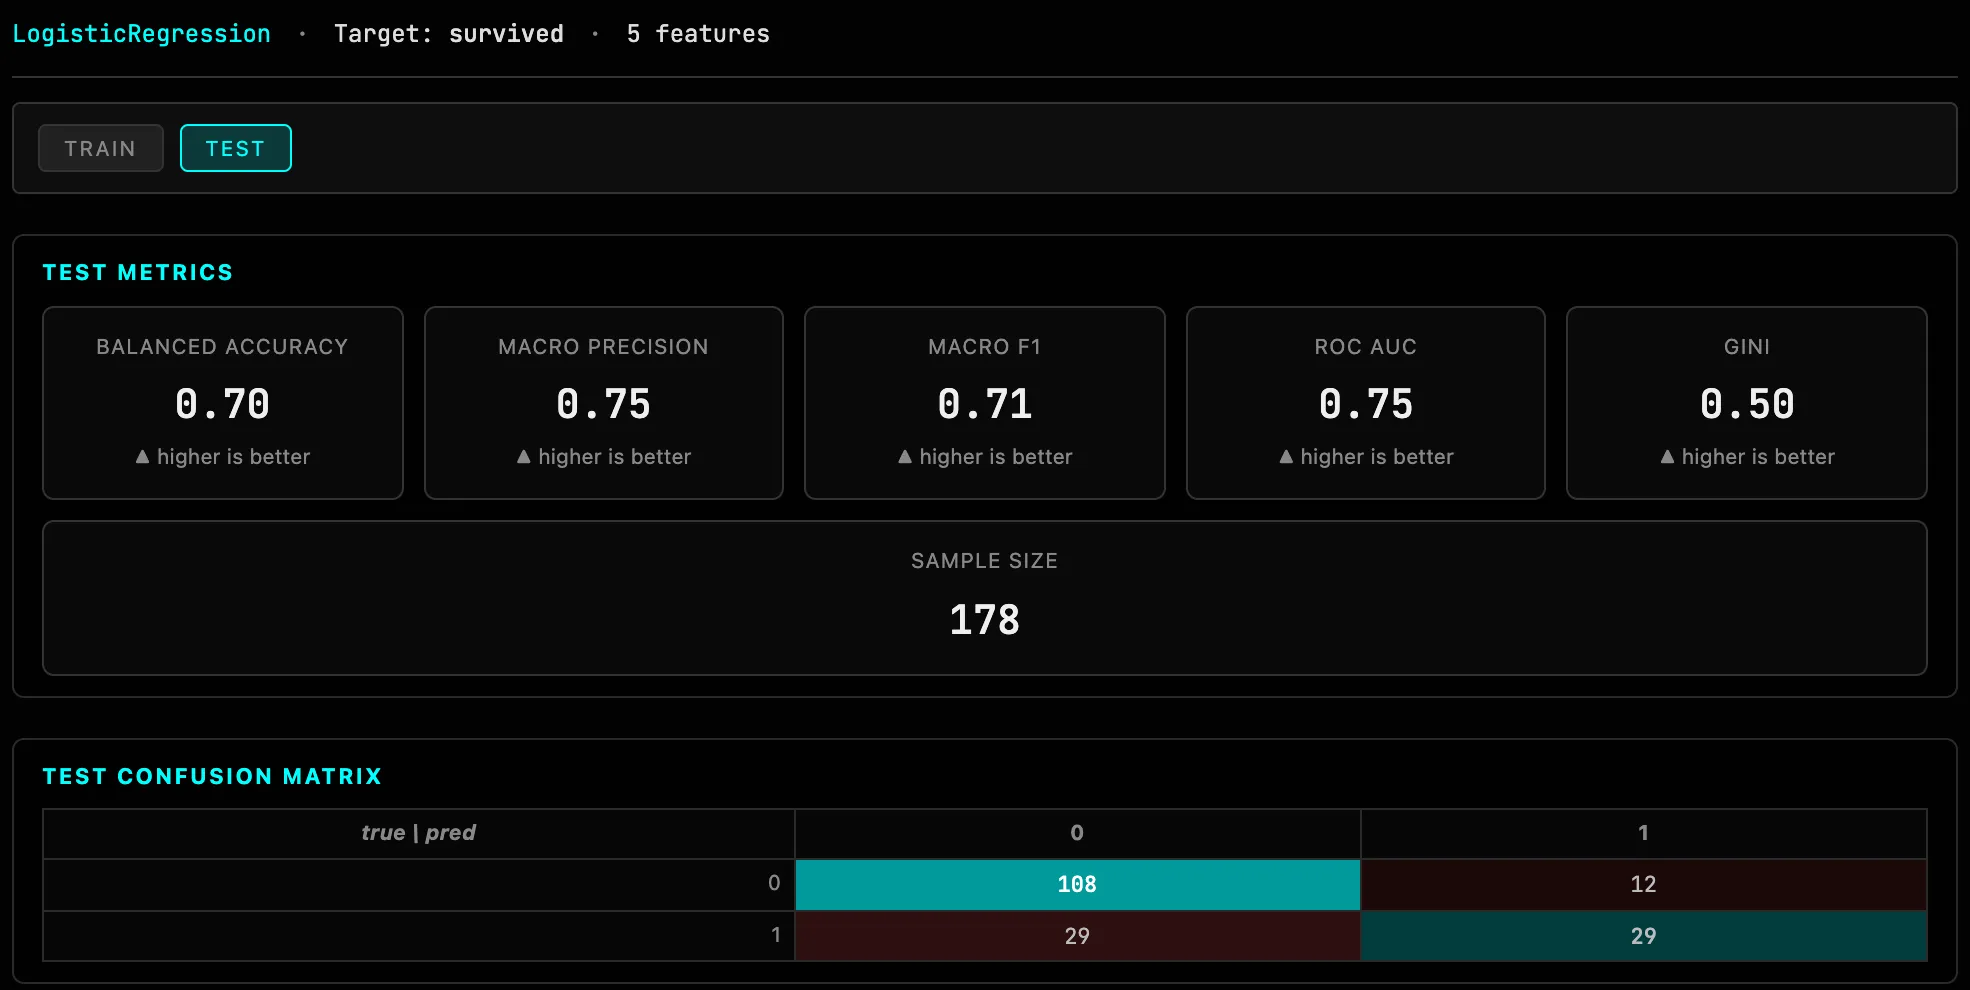
In Response mode, Estimator chooses between linear and logistic regression. Results come in two tabs, Train and Test: the second reads the sample set aside by the flag_test column, which tells how the model behaves on new data. Regression: R², MAE, RMSE. Classification: balanced accuracy, macro precision and F1, AUC, Gini, and the confusion matrix.
Missing values are replaced by the mean computed on the training rows alone, and the same mean is used for the test set: no column is dropped because it has gaps.
Know whom to target, and what the prediction rests on
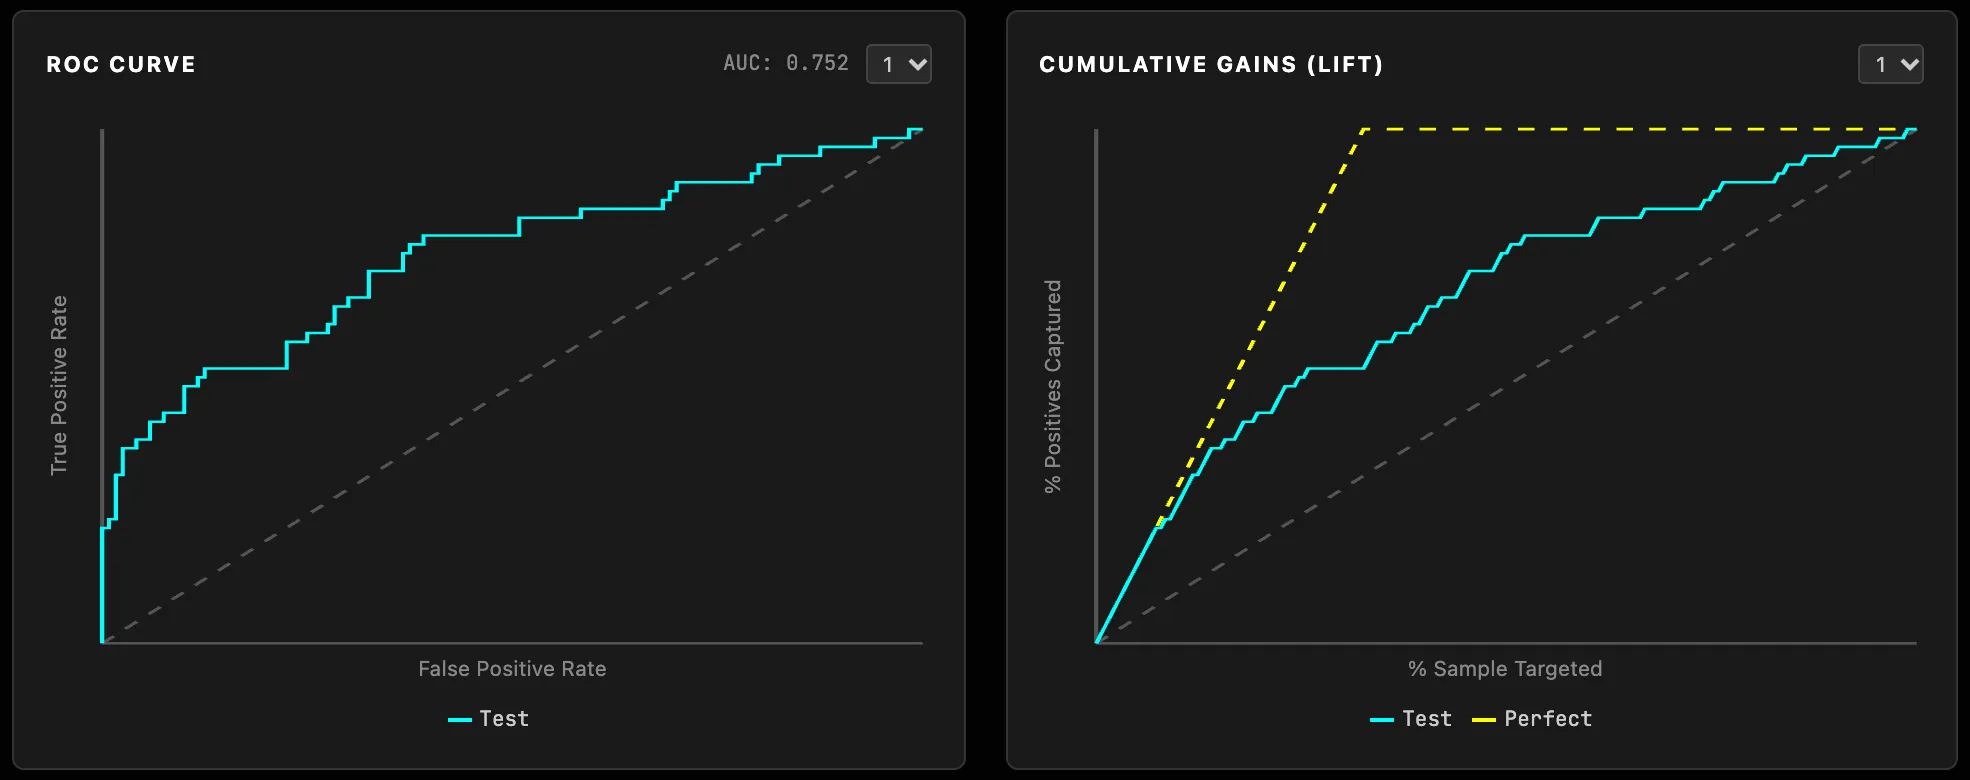
The coefficients, and for logistic regression the odds ratios, show the weight of each variable. The ROC curve measures how well the model separates the classes. The cumulative gains curve answers the targeting question: contacting only a share of the population, sorted by score, what share of the positives do you reach?
Target those the action actually changes
A response model says who will convert. Uplift mode says who converts because they were treated. The difference matters as soon as you target an action: a customer who would have bought anyway brings nothing to the campaign, and some even react badly to a follow-up. On A/B test data (Treatment, Treated Value), the score predicts for each individual the gap between their probability of success if treated and if not, from −1 to 1.
The arms are rebalanced automatically when their sizes differ. This reading assumes the treatment was assigned at random: on observational data, no setting corrects the bias.
Check that an uplift ranking is worth something
Uplift Charts splits individuals by decreasing score and measures, slice by slice, the uplift actually observed between treated and control, with its test and confidence interval. Cumulative Uplift (Top P%) answers the decision question: if I target only the top 30%, what effect do I get? The Qini coefficient sums up the value of the ranking: 1 for a perfect ranking, 0 for chance. BH Correction controls the risk of false positives when ten bars are read at once. The charts open on the test sample when there is one, so the model is not judged on the rows it was fitted on.
Reuse the score
Score Bins cuts the score into quantiles, which become groups to describe in profiling. Inference applies the model to a new file without re-estimating it, and Cluster Predictor adds the classes of a clustering to the explanatory variables. To measure the effect of actions at campaign level rather than per individual, see Hy-Performance.
Try it on your own data
Everything runs in your browser: your data never leaves it.
Open TetrachoreUpdated 6 November 2026