
Survival analysis
Plan : HyperMeasure the time to an event without counting customers who are still waiting as failures.

Business problems
- Find out whether an offer makes people buy sooner, and by how many days.
- Measure conversion fairly when part of the sign-ups has not yet had time to convert.
- Compare, action by action, the effect of a campaign on the time to purchase.
- Estimate a customer lifetime beyond the observation window.
Academic problems
- Teach censoring, and why a raw rate wrongly treats it as a failure.
- Illustrate the proportional hazards assumption, and what to read when it breaks.
Methods & guarantees
- Kaplan-Meier estimator, interval on the log-log scale by default, as in R and statsmodels.
- Median with the Brookmeyer-Crowley interval.
- Cox model with the Efron method for ties, the R default, and a Schoenfeld residuals test like cox.zph.
- Action-by-action table with Benjamini-Hochberg q-values.
Measure a delay without counting waiting customers as failures
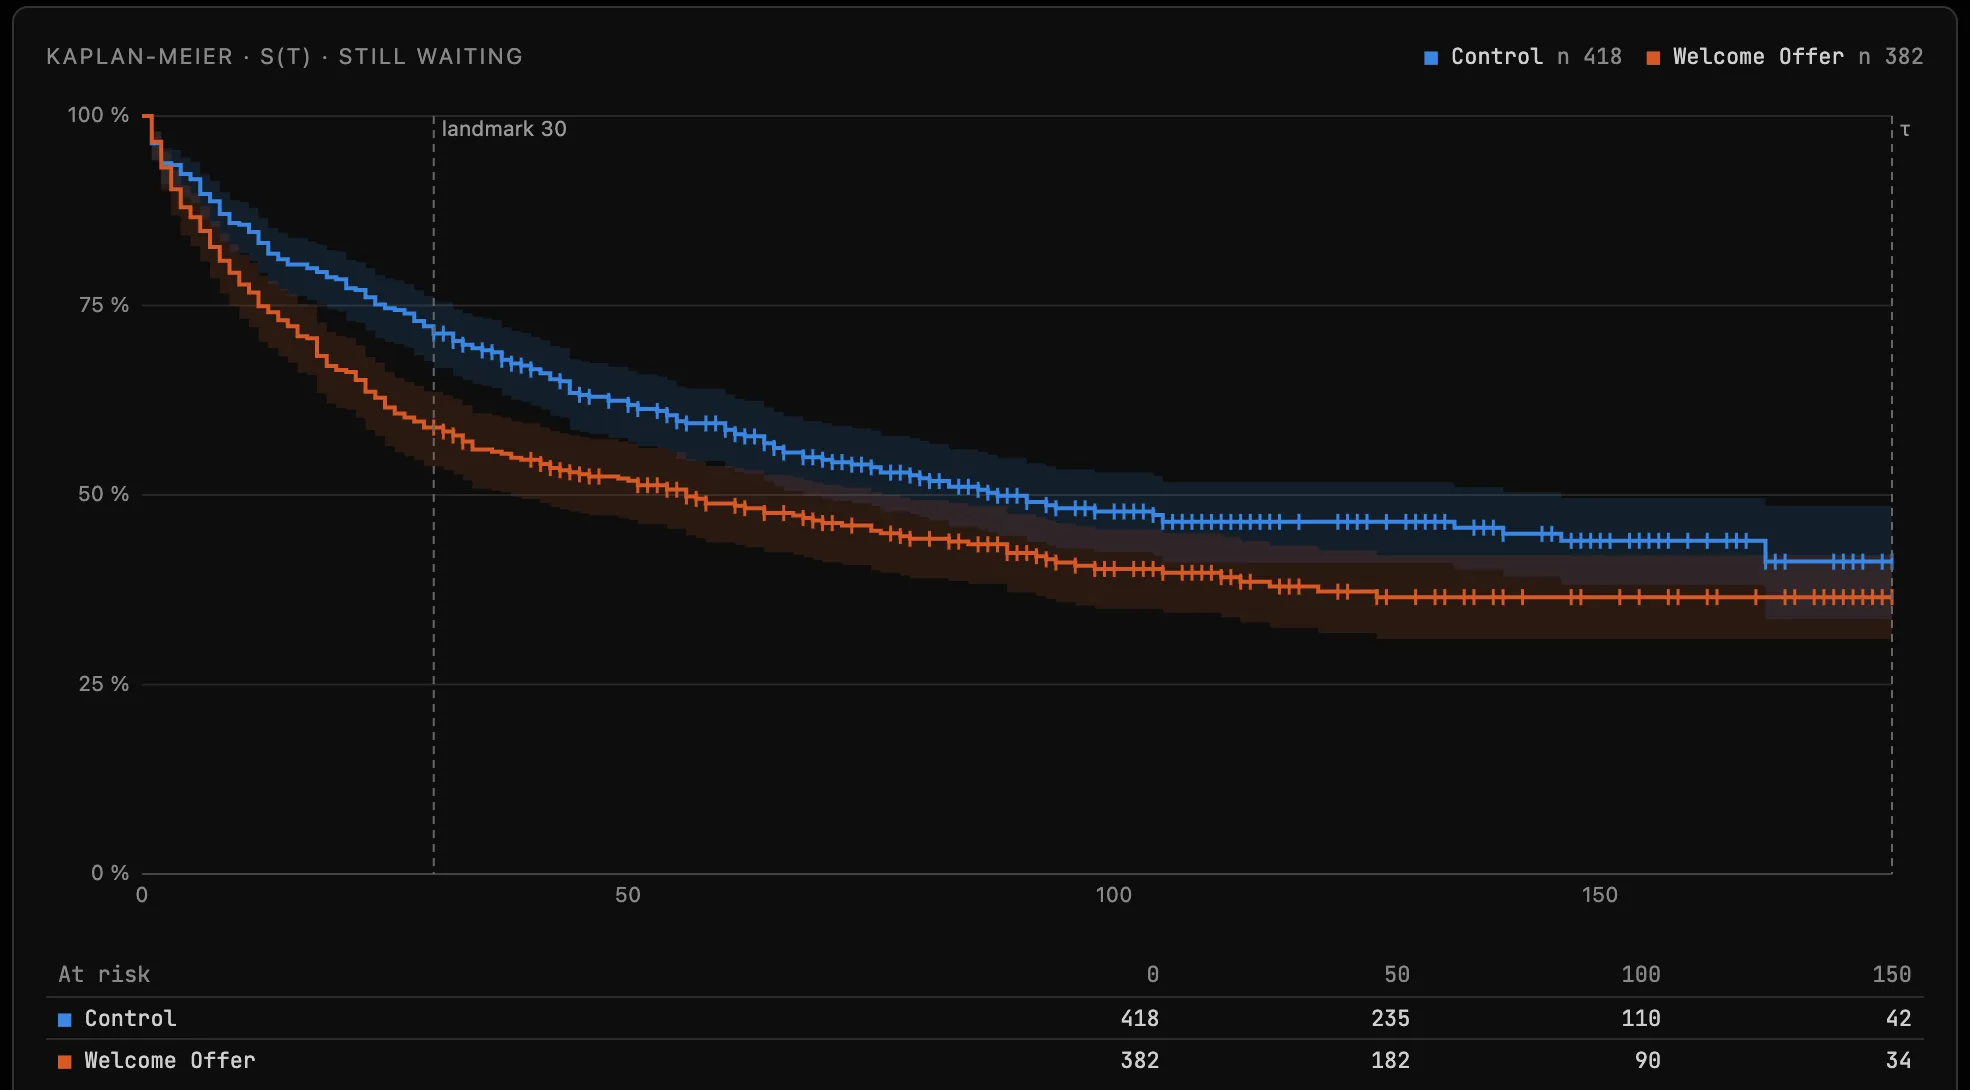
A customer still waiting when observation stops has neither converted nor failed: all we know is that they waited at least that long. A raw conversion rate counts them as a failure and penalises late sign-ups, who had less time to convert. The Kaplan-Meier estimator keeps them in the at-risk set until their end date, then removes them without classifying them: this is censoring.
Follow-up comes in two forms (Time Input): a duration and an event flag, or an origin date and an event date, closed by a cutoff date. Unusable rows are dropped and counted by reason, never silently.
Compare groups, and express the gap in days
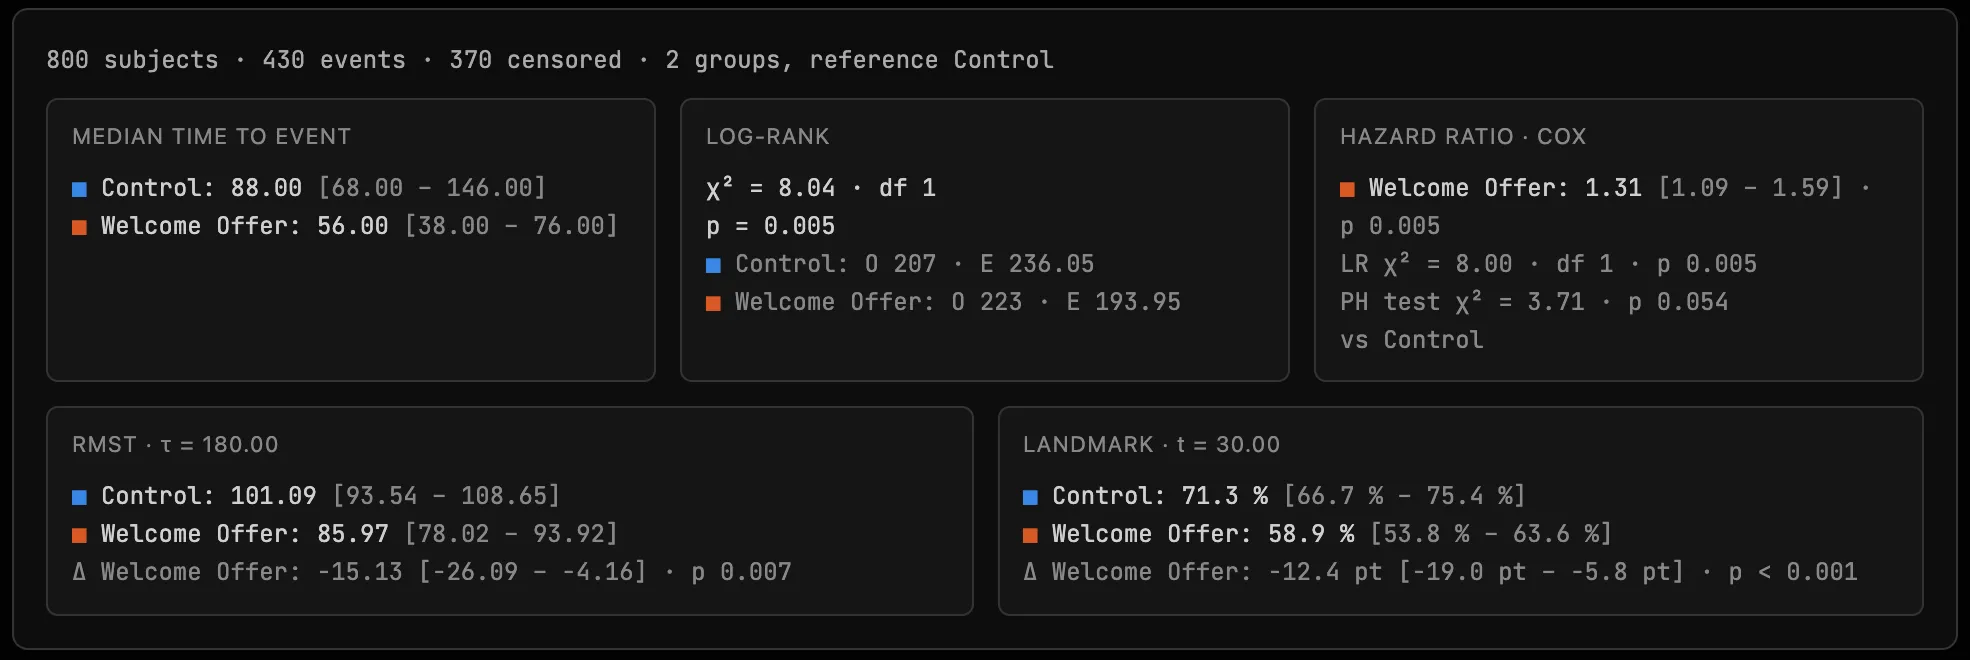
With a Group (target and control, segment, channel), five tiles compare each group with the Reference. The median gives the time by which half of the group had the event. The log-rank tests whether the curves differ. The Cox model gives a hazard ratio: 1.3 means 30% more events per unit of time than the reference. The RMST turns the gap into time: a ΔRMST of −15 on a time to purchase means 15 days gained on average over the window, with no assumption on the shape of the curves. The Landmark reads the curves at a chosen time, 30 days for instance.
Separate the effect of the offer from other differences
Strata compares the groups within each level of a column: a difference in speed between acquisition channels no longer passes for an effect of the offer. Covariates adjusts the Cox model for numeric or categorical columns, and shows the unadjusted hazard ratio next to it: a gap between the two points to a variable that was hiding or inflating the effect. The last line of the Cox tile checks that the hazard ratio stays the same over the whole follow-up. When it drifts, the line turns orange, and the Hazard ratio over time chart shows how.
Read a campaign action by action
By repeats the comparison within each level of a column, typically a marketing action, in a table: counts, ΔRMST and its interval, p-value, then the Benjamini-Hochberg q-value to read several actions at once without multiplying false discoveries. A customer file in the granular Hy-Performance format is set up automatically: actions, target and control, conversion.
Extend the curves beyond the follow-up
Extrapolation fits a parametric distribution (exponential, Weibull, log-normal or log-logistic, chosen by AIC) to read a one-year customer lifetime when the window closed at 90 days. Cure Fraction estimates the share of customers who will never have the event: the curve levels off instead of falling to zero. Finally, Vocabulary switches the results from marketing wording (conversion, customers still waiting) to clinical wording (cumulative incidence, event-free subjects), without changing a single figure.
Try it on your own data
Everything runs in your browser: your data never leaves it.
Open TetrachoreUpdated 6 November 2026